Energy
Energy Development
Energy is an essential input for economic development and improving the quality of life. Development of conventional forms of energy for meeting the growing needs of society at a reasonable cost is the responsibility of the Government Development and promotion of non-conventional /alternative/ new and renewable sources of energy such as solar, wind and bio energy etc are getting sustained attention. Nuclear energy development being geared up to contribute significantly to the overall energy availability in the country.
Universal access to affordable power in a sustainable manner is the guiding principle for the Power sector. Sources of power in India range from conventional sources to viable non-conventional sources. Almost 80 per cent of India’s energy requirements are met by coal, oil, natural gas and solid biomass (Source: International Energy Agency). India’s per capita emission is quite low but in absolute terms, it is the 3rd largest greenhouse gas emitter (country-wise) in the world. Per Capita Electricity Consumption of India in general and Kerala in particular is much below the world average.
India’s power sources range from traditional ones to sustainable unconventional origins. Over 80 per cent of India’s energy demands are fulfilled by three fuels: coal, oil, and solid biomass (Source: International Energy Agency 2021). The remarkable growth of solar and wind energy capacity of the country has enabled it to maintain its position as a global leader in renewable energy adoption. Today, India stands 4th globally in Renewable Energy Installed Capacity, with 43 per cent (as on September 30, 2023) of its total installed electricity capacity coming from nonfossil energy sources. (Source: Ministry of New and Renewable Energy (MNRE), GoI). India ranks 67th in the World Economic Forum energy transition index, which evaluates 120 economies’ energy systems. This index is developed by considering the three energy triangle imperatives-equity, security, and sustainability - while effectively utilizing energy transition enablers.
(Source: World Economic Forum).
Power Sector - Indian Scenario
The national grid has an installed capacity of 4,24,288 MW as on August 31, 2023. In India, electricity from thermal energy is the dominant source of power. It constitutes nearly 56.19 per cent of the total installed capacity in the country. Contribution of electricity generation from different sources to the national grid. Of late, renewable sources have emerged as the second largest electricity source in the country, relegating hydroelectric power to the third position.
Installed Capacity (MW) in India 2022-23
|
Fuel
|
Installed Capacity (MW)
|
|
As on 31.03.2023
|
%
|
As on 31.08.2023
|
%
|
|
Thermal
|
2,37,268.91
|
57.02
|
2,38,443
|
56.19
|
|
Hydro
|
46,850.17
|
11.26
|
46,850
|
11.04
|
|
Nuclear
|
6,780.00
|
1.62
|
7,480
|
1.76
|
|
Renewable Sources
|
1,25,159.81
|
30.08
|
1,31,515
|
30.99
|
|
Total
|
4,16,058.89
|
|
4,24,288
|
|
|
Source: Central Electricity Authority (CEA)
|
In the sector-wise breakup of total energy generation as on August 31, 2023, the contribution of the State sector is 1,05,749 MW (24.92 per cent), Central sector 1,01,415 MW (23.90 per cent), and private sector, 2,17,124 MW (51.17 per cent).
Installed Capacity (MW) in India 2022-23, Sector-wise
|
Sector
|
Installed Capacity (MW)
|
|
As on 31.03.2023
|
%
|
As on 31.08.2023
|
%
|
|
Central Sector
|
1,00,054.93
|
24.04
|
1,01,415
|
23.90
|
|
State Sector
|
1,05,726.43
|
25.41
|
1,05,749
|
24.92
|
|
Private Sector
|
2,10,277.53
|
50.54
|
2,17,124
|
51.17
|
|
Total
|
4,16,058.89
|
|
4,24,288
|
|
|
Source: Central Electricity Authority (CEA)
|
India posts the fastest electricity demand growth rate through 2026, among major economies (IEA’s Electricity Mid-Year Update,2024). The national grid has an installed capacity of 4,41,970 MW as on March 31, 2024. In India, electricity from thermal energy is the dominant source of power. It constitutes nearly 55 per cent of the total installed capacity in the country. The contribution of electricity generation from different sources is given below. Recently, renewable sources have emerged as the second largest electricity source, relegating hydroelectric power to the third position.
|
Installed Generation Capacity (MW) in India as on 31.03.2024
|
|
Sl No
|
Fuel
|
Installed Capacity (MW)
|
|
As on 31.03.2024
|
per cent
|
|
1
|
Thermal
|
2,43,217
|
55
|
|
2
|
Hydro
|
46,928
|
10.6
|
|
3
|
Nuclear
|
8,180
|
1.8
|
|
4
|
Renewable Sources
|
1,43,645
|
32.5
|
|
Total
|
4,41,970
|
|
|
Source: Annual Report 2023-24, Ministry of Power, GoI
|
In the sector-wise breakup of total energy generation as given in the Table below, as on March 31, 2024, the contribution of the State sector is 1,07,670 MW (24.4 per cent), Central sector is 1,04,453 MW (23.6 per cent), and private sector is 2,29,847 MW (52 per cent).
|
Installed Generation Capacity (MW) in India as on 31.03.2024, Sector wise
|
|
Sl No
|
Sector
|
Installed Capacity (MW)
|
|
As on 31.03.2024
|
per cent
|
|
1
|
Central Sector
|
1,04,453
|
23.6
|
|
2
|
State Sector
|
1,07,670
|
24.4
|
|
3
|
Private Sector
|
2,29,847
|
52
|
|
Total
|
4,41,970
|
|
|
Source: Central Electricity Authority (CEA), Ministry of Power, Gol
|
Power Sector in Kerala
Kerala is among the Front Runner States in the State Energy Efficiency Index published by Bureau of Energy Efficiency, Ministry of Power, Government of India. Though highly dependent on imported power, the State could provide power for all on demand, without imposing on restrictions such as load shedding or power cut. Power development activities in the State are carried out mainly through four agencies, namely, Kerala State Electricity Board Limited (KSEBL), Agency for Non-conventional Energy and Rural Technology (ANERT), Electrical Inspectorate, and Energy Management Centre (EMC).The Table below shows the details growth of the power system in the State for the last five years.
Growth of Power System at a Glance during 2018-23
| |
Position as on 31.03.2023
|
|
Particulars
|
Unit
|
2018-19
|
2019-20
|
2020-21
|
2021-22
|
2022-23
|
|
Installed Capacity
|
MW
|
3000.35
|
3063.15
|
3029.65
|
3145.82
|
3514.81
|
|
Annual Sales (within State & Open access)
|
MU
|
21750.25
|
23058.91
|
22540.30
|
23983.42
|
25383.77
|
|
Per capita consumption
|
kWh
|
626
|
657
|
619
|
676
|
682
|
|
Export per annum
|
MU
|
1030.20
|
323.84
|
633.39
|
2244.73
|
1832.24
|
|
Import per annum
|
MU
|
17982.15
|
20827.12
|
18708.40
|
19156.36
|
18249.07
|
|
Consumers
|
Nos. (lakh)
|
125.52
|
128.26
|
131.43
|
134.22
|
136.48
|
|
Street Lights
|
Nos.
|
1422764
|
1447820
|
1476776
|
2301556
|
2351628
|
|
Revenue from sale of power per annum
|
Rs(Lakh)
|
1352121
|
1431882
|
1405353
|
1596204
|
1770546
|
|
Source: KSEBL
|
In Kerala, electricity consumption is predominantly in the domestic and commercial sectors. As per the Energy Data Management report published by the Bureau of Energy Efficiency in 2023, in India, the electricity consumption in agriculture is around 18 per cent. In many States, it is above 30 per cent of the total electricity consumption; but in Kerala, agricultural consumption is only 1.7 per cent.
The primary energy source in the State is hydroelectric power. In recent years, there has been a significant increase in Variable and Renewable Energy (VRE) sources, such as solar and wind, within the energy mix. The State has made significant steps towards implementing various schemes and programmes aimed at establishing a resilient and reliable power transmission and distribution network. The addition of critical infrastructure elements in the electrical network in 2023-24 marked a major milestone in strengthening the State’s ability to manage and sustain increased electricity demands, ensuring a more robust and reliable power supply system for future needs. The growth of the power system in Kerala during the last three years, is given below:
|
Growth of Power System in Kerala at a Glance (2021-2024)
|
|
Particulars
|
Position as on 31.03.2024
|
|
Unit
|
2021-22
|
2022-23
|
2023-24
|
|
Installed Capacity
|
MW
|
3,145.98
|
3,514.81
|
3,818.82
|
|
Annual Sales (within State &Open Access)
|
MU
|
23,983.4
|
25,383.8
|
28,360.3
|
|
Per Capita Consumption
|
kWh
|
676.0
|
682.0
|
756.0
|
|
Export per annum
|
MU
|
2,244.7
|
1,832.2
|
760.0
|
|
Import per annum
|
MU
|
19,156.4
|
18,249.1
|
25,851.4
|
|
Consumers
|
Nos.(Lakh)
|
134.2
|
136.5
|
138.6
|
|
HT Lines(11 kV&22 kV lines)
|
Kms
|
66,637.0
|
67,920.00
|
70,072.0
|
|
LT Lines
|
Kms
|
299,538.0
|
302,626.0
|
310,191.0
|
|
Distribution Transformers
|
Numbers
|
85,594.0
|
87,584.0
|
89,620.0
|
|
Capacity - MVA
|
10,448.0
|
10,727.0
|
11,905.0
|
|
Street Lights
|
Nos.
|
2,301,556.0
|
2,351,628.0
|
2,355,821.0
|
|
Revenue from sale of power per annum*
|
(Rs lakh)
|
1,596,204.0
|
1,770,546.0
|
2,006,500.0
|
|
*based on standalone ‘Profit & Loss statement of KSEBL’
Source: Kerala State Electricity Board Ltd (KSEBL)
|
Power Availability:
The quantum of power available in the State is met from Central Stations, private generators, Power Exchanges and also from internal sources including stations owned by KSEBL, Independent Power Producers (IPPs), Captive power plants (CPPs), and prosumer. Details are given below:
Energy Sources and Quantum Procured during 2022-23
|
Particulars
|
|
Energy (MU)
|
|
Gross generation KSEBL (excluding auxiliary consumption)
|
A
|
8560.33
|
|
Power purchase from CGS at Kerala periphery
|
B
|
10386.03
|
|
Power purchase through long term/medium term/short term contracts/swap at Kerala periphery
|
C
|
9679.25
|
|
Total Power purchase from IPPs/CPPs inside the State
|
D
|
1068.01
|
|
Total power purchase at Kerala periphery [ Row 2+3+4]
|
E = B + C + D
|
2113.29
|
|
Energy injected by Private IPPs at generated end for sale outside the State through open access
|
F
|
52.77
|
|
Energy availed through open access at Kerala Periphery
|
G
|
135.32
|
|
Auxiliary consumption
|
H
|
23.18
|
|
EXPORT - Energy sales by KSEBL, SWAP Return by KSEBL and Energy injected by Private IPP’s at KSEB periphery for sale outside the State through open access
|
I
|
1881.38
|
|
Total energy input to Kerala periphery for meeting the consumption of the State including energy wheeled through open access
|
J = A + E + F + G – H – I
|
27977.16
|
|
Source: KSEBL
|
In Kerala, power supply comes from central stations, private generators, power exchanges, and internal sources including stations owned by Kerala State Electricity Board Ltd (KSEBL), Independent Power Producers (IPPs), Captive Power Plants (CPPs), and prosumers. Details are given in below:
|
Energy sources & Quantum procured during 2023-24
|
|
Particulars
|
Energy (MU)
|
|
Gross generation KSEBL
|
A
|
5,716.43
|
|
Power purchase at Kerala periphery through
• CGS
• Long term/medium term/short term contracts
• Power exchange
• Swap
• DSM
|
B
|
24,922.95
|
|
Total power purchase from IPPs/CPPs inside the State
|
C
|
1,273.35
|
|
Total power purchase at Kerala periphery
|
D=B+C
|
26,196.3
|
|
Energy injected by Private IPPs at generated end for sale outside the
State through open access
|
E
|
78.36
|
|
Energy availed through open access at Kerala Periphery
|
F
|
266.09
|
|
Auxiliary consumption
|
G
|
90.08
|
|
EXPORT-Energy sales by KSEBL, SWAP Return by KSEBL and Energy injected by Private IPP’s at KSEB periphery for sale outside the State through open access
|
H
|
759.96
|
|
Total energy input to Kerala periphery for meeting the consumption of the State including energy wheeled through open access
|
I=A+D+E+F-G-H
|
31,407.14
|
|
Source: KSEBL
|
Power Demand:
Peak demand of the State during 2022-23 was 4517 MW (on March 28, 2023), indicating 3.12 per cent increase from 4380.04 MW in 2021-22. Morning peak demand was 3611 MW and day peak demand was 4096 MW for 2022-23. The energy requirement and maximum demand for energy during the last five years.
Requirement and Maximum Demand for Energy during the Last Five Years
.jpg)
Source: KSEBL
The State’s electricity demand is projected to grow at a CAGR of 5.1 per cent from 2023-24 to 2029- 30, as per the forecast by the 20th Electric Power Survey India (Source: Central Electricity Authority, Ministry of Power, GoI).
The State’s all-time maximum peak demand and power consumption was reported in 2023-24. Peakdemand of the State in 2023-24 was 5,301 MW (on March 26, 2023), a 17.3 per cent increase from4,517 MW- the peak demand in 2022-23. In 2023- 24, the morning peak demand was 4,019 MW, and the day peak demand was 4,638 MW.
Generation:
The power generation landscape in the State includes hydroelectric, thermal, wind and solar plants and they collectively contribute the State’s electricity generation capacity. Total installed capacity of power in the State as on March 31, 2023 is 3,514.81 MW, of which, hydel power contributed the major share of 2,173.57 MW (61.84 per cent); while 734.42 MW was contributed by solar power (20.90 per cent), 536.54 MW (15.27 per cent) from thermal and 70.28 MW from wind (2 per cent). Appendix 11.2.3 gives the details of energy source and its installed capacity during the last five years, while sector-wise details are presented in Appendix 11.2.4. The total installed capacity of Kerala from hydel, thermal, and renewable sources are given below:
(Appendix 11.2.3) Energy Source in Kerala from 2018-2023 (MW)
|
Source of Energy
|
2018-19
|
2019-20
|
2020-21
|
2021-22
|
2022-23
|
|
Hydel: KSEB
|
2058.76
|
2058.76
|
2058.76
|
2066.36
|
2090.36
|
|
Thermal: KSEB
|
159.96
|
159.96
|
159.96
|
159.96
|
159.96
|
|
Wind: KSEB
|
2.03
|
2.03
|
2.03
|
2.03
|
2.03
|
|
Solar: KSEB
|
16.85
|
17.47
|
17.51
|
30.28
|
47.54
|
|
Solar other than
KSEBL
|
117.27
|
169.43
|
180.85
|
276.81
|
492.88
|
|
Solar :IPP
|
|
|
102.00
|
102.00
|
194.00
|
|
NTPC(Thermal
IPP)
|
359.58
|
359.58
|
359.58
|
359.58
|
359.58
|
|
Thermal: CPP
|
157.00
|
167.00
|
10.00
|
10.00
|
17.00
|
|
Hydel: CPP
|
33.00
|
33.00
|
33.00
|
33.00
|
33.00
|
|
Hydel: IPP
|
37.66
|
37.66
|
37.71
|
37.71
|
50.21
|
|
Wind: IPP
|
58.25
|
58.25
|
58.25
|
58.25
|
58.25
|
|
Wind:CPP
|
|
10.00
|
10.00
|
10.00
|
10.00
|
|
Total
|
3000.36
|
3073.14
|
3029.65
|
3145.82
|
3514.81
|
|
Source : KSEBL
|
(Appendix 11.2.4) Total Installed Capacity in Kerala from 2018-2023
|
Sector
|
2018-19
|
2019-20
|
2020-21
|
2021-22
|
2022-23
|
|
State Sector
|
2237.60
|
2238.22
|
2238.26
|
2258.47
|
2299.89
|
|
Central Sector
|
359.58
|
359.58
|
359.58
|
359.58
|
359.58
|
|
Private Sector
|
403.18
|
475.34
|
431.81
|
527.93
|
855.34
|
|
Total
|
3000.36
|
3073.14
|
3029.65
|
3145.98
|
3514.81
|
|
Source : KSEBL
|
Of the total installed capacity of 3,514.81 MW in 2022-23, the contribution of State sector is 2299.89 MW (65.43 per cent), central sector 359.58 MW (10.23 per cent), and private sector 855.34 MW (24.33 per cent).
Total installed capacity of Kerala in 2022-23 in Percent
.jpg)
Source : KSEBL
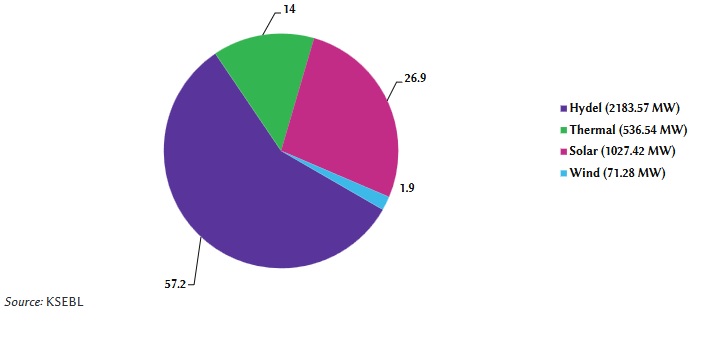
The power generation landscape in the State includes hydroelectric, thermal, wind and solar plants. Total installed capacity of power in the State as on March 31, 2024 is 3,818.82 MW, of which, hydel power contributed the major share of 2,183.57 MW (57.2 per cent); while 1,027.4 MW was contributed by solar power (26.9 per cent), 536.54 MW (14.0 per cent) from thermal and 71.3 MW from wind (1.9 per cent). The details of energy source and its installed capacity during the last five years and sectorwise details are presented the table below. The Figure highlights the total installed capacity of Kerala from hydel, thermal, and renewable sources.
|
Source of Energy
|
2019-20
|
2020-21
|
2021-22
|
2022-23
|
2023-24
|
|
Hydel: KSEB
|
2,058.76
|
2,058.76
|
2,066.36
|
2,090.36
|
2,096.36
|
|
Thermal: KSEB
|
159.96
|
159.96
|
159.96
|
159.96
|
159.96
|
|
Wind: KSEB
|
2.03
|
2.03
|
2.03
|
2.03
|
2.03
|
|
Solar: KSEB
|
17.47
|
17.51
|
30.28
|
47.54
|
49.24
|
|
Solar other than KSEBL
|
169.43
|
180.85
|
276.81
|
492.88
|
774.18
|
|
Solar: IPP
|
0
|
102.00
|
102.00
|
194.00
|
204.00
|
|
NTPC (Thermal IPP)
|
359.58
|
359.58
|
359.58
|
359.58
|
359.58
|
|
Thermal: CPP
|
167.00
|
10.00
|
10.00
|
17.00
|
17.00
|
|
Hydel: CPP
|
33.00
|
33.00
|
33.00
|
33.00
|
33.00
|
|
Hydel: IPP
|
37.66
|
37.71
|
37.71
|
50.21
|
54.21
|
|
Wind: IPP
|
58.25
|
58.25
|
58.25
|
58.25
|
58.25
|
|
Wind:CPP
|
10.00
|
10.00
|
10.00
|
10.00
|
11.01
|
|
Total
|
3,073.14
|
3,029.65
|
3,145.98
|
3,514.81
|
3,818.82
|
|
Source: KSEBL
|
Total Installed capacity (MW) in Kerala in 2023-24 (in per cent)
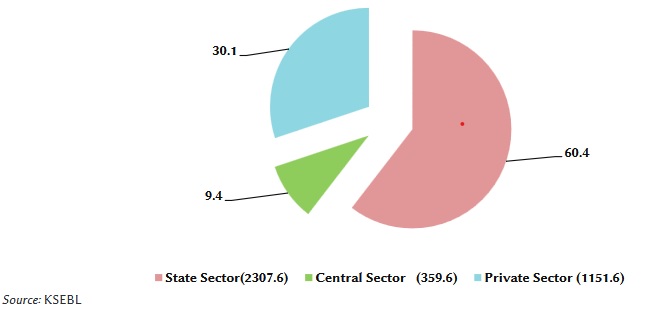
Of the total installed capacity of 3,818.8 MW in 2023-24, the contribution of State sector is 2307.6 MW (60.4 per cent), central sector is 359.6 MW (9.4 per cent), and private sector is 1151.6 MW (30.1 per cent). The sector-wise details on installed capacity is shown the Figure below and the details of surplus power during the last five years are shown in the table.
Total Installed capacity (MW) in Kerala in 2023-24, sector wise (in per cent)
|
Particulars
|
2019-20
|
2020-21
|
2021-22
|
2022-23
|
2023-24
|
|
Hydel Generation
|
5,741.83
|
7,071.37
|
9,836.91
|
8,636.52
|
5,663.67
|
|
KSEB-Thermal Generation
|
12.03
|
7.85
|
-
|
0.12
|
-
|
|
Wind KSEBL
|
1.42
|
1.14
|
1.16
|
1.19
|
1.21
|
|
Solar KSEBL
|
25.95
|
28.73
|
20.20
|
21.55
|
51.56
|
|
Solar other than KSEBL
*(incl in power purchase)
|
84.49
|
134.15
|
156.45
|
309.18
|
919.01
|
|
Total Internal generation
|
5,781.23
|
7,109.09
|
9,858.27
|
8,659.38
|
5,716.40
|
|
Auxiliary consumption
|
58.42
|
51.19
|
115.98
|
122.23
|
90.88
|
|
Net generation
|
5,722.81
|
7,057.90
|
9,742.29
|
8,537.15
|
5,625.55
|
|
Power Purchase
(CGS, IPPs, Traders)
|
21,128.51
|
18,912.33
|
19,532.67
|
21,876.93
|
27,066.50
|
|
External PGCIL line losses
|
744.75
|
649.89
|
645.05
|
743.63
|
870.21
|
|
Energy available for sale within the State
|
26,106.57
|
25,320.24
|
28,968.69
|
29,670.45
|
31,821.84
|
|
Energy Requirement**
|
26,050.62
|
25,058.81
|
26,535.53
|
27,857.35
|
31,750.57
|
|
Surplus/Deficit
|
55.95
|
261.43
|
2,094.43
|
1,813.10
|
71.27
|
|
*Item 5 is shown in power purchase
** Swap return & dsm export is also shown in energy requirement
Source: KSEBL
|
The total installed capacity of the Kerala State Electricity Board Limited, as on 31.03.2024, is 2,307.6 MW. This is generated by 41 hydel stations of capacity 2,096.4 MW, two thermal plants of 160 MW, solar plants of 49.2 MW, and one wind farm of 2.0 MW. Due to the high production costs associated with power generation, KSEB does not rely on thermal plants for daily electricity needs. Details are shown below:
|
KSEB Internal Generation
|
|
Particulars
|
Capacity as on 31.3.2024
(MW)
|
Total Internal Generation in 2023-24 (MU)
|
|
1
|
2
|
3
|
|
Hydel
|
2,096.4
|
5,663.6
|
|
Thermal
|
160
|
0
|
|
Solar
|
49.2
|
51.6
|
|
Wind
|
2.0
|
1.2
|
|
Total
|
2,307.6
|
5,716.4
|
|
Source: KSEBL
|
Transmission:
Kerala has 432 transmission substations with 14,431.11 circuit km lines having 25555.70 MVA total transformation capacity of which 6 stations (1755.61 Ckm) owned by Power Grid Corporation of India(PGCIL) , as on March 31, 2023.
Kerala has 431 transmission substations with 14,724.2 circuit km lines having 26,365.7 MVA total transformation capacity, of which 6 stations (1,813.9 Ckm) are owned by Power Grid Corporation of India (PGCIL), as on March 31, 2024.
In 2023-24, seven EHT (Extra High Tension) substations including one 400 kV and six 110 kV substations were commissioned, which added an additional 297.1 circuit km of transmission lines with 890.7 MVA capacity. The commissioning of Kerala’s first 400 kV gas insulated substation at Kottayam was another important achievement in the Transmission sector. Additionally, the commissioning of two 500 MVA interconnecting transformers at Kochi and Palakkad along with downstream works increased the State’s import capacity by nearly 1000 MW, elevating it to a total of 4620 MW.
Transgrid 2.0
The ambitious Transgrid 2.0 project aimed at enhancing the transmission capacity for meeting future demand, improving reliability and quality of power transmitted and to reduce losses. Out of the 12 substations targeted in the first phase of the Transgrid 2.0 project (2017-23), 11 substations and 1490 ckm of EHT lines were completed till March 31, 2023. In 2022-23, 6 new substations were completed of which, 4 stations were completed as part of Transgrid 2.0 project. Kerala’s transmission infrastructure consisting of substations as on March 31, 2023 and details on substations and lines completed in 2022-23 are given below:
|
Transmission Infrastructure in Kerala (as on 31.03.2023)
|
|
Sl. No
|
Voltage level (kV)
|
Substations Nos.
|
Transmission Lines in ckt.km
|
|
1
|
400 kV*
|
7
|
1465.32
|
|
2
|
220 kV
|
33
|
3613.30
|
|
3
|
110 kV
|
177
|
5460.85
|
|
4
|
66 kV
|
55
|
1542.23
|
|
5
|
33 kV
|
160
|
2349.41
|
|
|
Total
|
432
|
14431.11
|
|
6 substations are owned by Power Grid Corporation of India Ltd (PGCIL)
Source: KSEBL,
|
|
Transmission Infrastructure Achievement during 2022-23
|
|
Sl. No
|
Voltage Level (kV)
|
Substations (Nos)
|
Transmission Lines (Ckt-km)
|
Capacity addition enhancements (MVA)
|
|
1
|
220
|
4
|
88.41
|
763
|
|
2
|
110
|
2
|
132
|
657.5
|
|
4
|
33
|
|
10
|
65
|
|
Total
|
6
|
229.7
|
1485.5
|
|
Source: KSEBL
|
The ambitious Transgrid 2.0 project aimed at enhancing transmission capacity to meet future demand, improve reliability and quality of power transmitted, and to reduce losses. All 12 substations targeted in the first phase of the Transgrid 2.0 project (2017-23) have been commissioned, with around 1,746 circuit km of lines completed.
Out of the total 7 new substations in 2023-24, one was completed as part of Transgrid 2.0 project. Kerala’s transmission infrastructure as on March 31, 2024 and details on substations and lines completed in 2022-23 are given below:
|
Sl No
|
Voltage level(kV)
|
Substations (Nos)
|
Transmission Lines (Ckt.km)
|
|
1
|
400 kV*
|
8
|
1,449.4(including PGCL-1,271.14)
|
|
2
|
320 kV (HVDC**)
|
-
|
1,30.35 (including PGCL-130.46)
|
|
3
|
220 kV
|
33
|
3,614.56 (including PGCL-412.39)
|
|
4
|
110 kV
|
182 (excl. others-1)
|
5,663.36
|
|
5
|
66 kV
|
49 (excl. others-1)
|
1,486.60
|
|
6
|
33 kV
|
159 (excl. others-1)
|
2,379.88
|
|
Total
|
431(incl.PGCIL
6/exc.Others-3)
|
14,724.15 (incl PGCIL-1813.87)
|
|
* 6 substations are owned by Power Grid Corporation of India Ltd(PGCIL)
**High Voltage Direct Current (HVDC) system
Source: KSEBL
|
|
Sl No
|
Voltage Level (kV)
|
Substations (Nos)
|
Transmission
Lines (Ckt-km)
|
Capacity addition/
Enhancement (MVA
|
|
1
|
400
|
1
|
1.12
|
0
|
|
2
|
220
|
0
|
18.12
|
630
|
|
3
|
110
|
6
|
248.38
|
207
|
|
4
|
66
|
0
|
0
|
5.7
|
|
5
|
33
|
0
|
29.45
|
48
|
|
Total
|
7
|
297.07
|
890.7
|
|
Source: KSEBL
|
Pattern of Power Consumption:
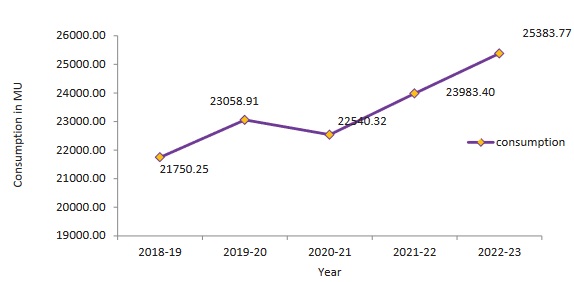
The electrical energy consumption in the State has increased to 25383.77 MU (includes open access consumption) in 2022-23 from 23,983.40 MU in 2021-22, an increase of 5.83 per cent. Electrical energy consumption in Kerala from 2018-19 to 2022-23 is depicted. The total number of consumers as on March 31, 2023 was 1,36,48,851. KSEB has sold 26736.62 MU power, which includes own consumers, sales outside state and also sale to other bulk licensees. An amount of Rs 17,705.46 crore was collected as revenue from the sale of power in 2022-23.
Electrical Energy Consumption in Kerala during 2018-19 to 2022-23
Source: KSEBL
The electrical energy consumption in Kerala has increased to 28,360.25 MU (including open access consumption, and excluding consumption against captive generation) in 2023-24, from 25,383.77 MU in 2022-23. This is an increase of 11.7 per cent. This unusual increase in power consumption was because of the severe summer faced by the State. Electrical energy consumption in Kerala from 2019-20 to 2023-24 is given below:
Transmission & Distribution (T&D) loss (2019-20 - 2023-24), in per cent
.jpg)
The total number of consumers as on March 31, 2024 was 1,38,64,176, with 1,04,94,734 (75.7per cent) domestic and 26,14,838 (18.9 per cent) commercial users. KSEB has sold 27,674.73 MU power, which includes its own consumers, sales outside State, and also sale to other bulk licensees. The contribution of the domestic sector to consumption was 49.6 per cent, and that of commercial establishments was 16.9 per cent. The contribution of the industrial category (which comes to 1.1 per cent of total consumers) was 26.6 per cent.
Distribution:
The distribution network as on March 31, 2023 has 67,920 circuit km of 11 kV & 22 kV lines, 3,02,626 circuit km of LT lines, and 87,584 distribution transformers with step down capacity of 10,727 MVA. Major works completed in the distribution sector during 2022-23 indicates more than 100 per cent achievement above the targets. The target and achievement of the distribution infrastructure during 2022-23 are given below.
|
Targets & achievements of distribution infrastructure during 2022-23
|
|
Sl No
|
Item
|
Target
|
Unit
|
Achievement
|
Unit
|
|
1
|
11 kV lines
|
1156
|
km
|
1557
|
km
|
|
2
|
Distribution Transformer
|
1721
|
nos
|
2283
|
nos
|
|
3
|
Lt lines
|
2921
|
km
|
4036
|
km
|
|
4
|
Service connections
|
360990
|
nos
|
373133
|
Nos
|
|
Source: KSEBL
|
The distribution network as on March 31, 2024 has 70,072 circuit km of 11 kV & 22 kV lines, 3,10,191 circuit km of LT lines, and 89,620 distribution transformers with step down capacity of 11,905 MVA. In the distribution sector, 1,297 kms of HT lines and 4,078 kms of LT lines were constructed, and 2,355 new distribution transformers were installed in 2023-24. The number of new service connections during the year was 3,38,864. The target and achievement of the distribution infrastructure during 2023-24 are given below:
|
Sl No
|
Item
|
Target
|
Unit
|
Achievement
|
Unit
|
|
1
|
11 kV lines
|
2,200.00
|
ckm
|
1,297.00
|
ckm
|
|
2
|
Distribution Transformer
|
2,200.00
|
nos
|
2,355.00
|
nos
|
|
3
|
LT lines
|
2,950.00
|
km
|
4,078.00
|
km
|
|
4
|
Service connections
|
303,640.00
|
nos
|
338,864.00
|
nos
|
|
Source: KSEBL
|
Power Sector in Kerala 2006-22
Simple Steps to Save Energy
Energy Conservation Tips
Installed Capacity and Generation of Hydel Power in Kerala State for a period of 1957-2023
Renewable energy -Annual Generation MU 2009-2022
Source: Economic Review 2024