|
District-Wise Forest Cover in Kerala (km2)
|
|
District
|
Calculated Area by Sol
|
2023 Assessment
|
% of Calculated Area by Sol
|
Change w.r.t 2021 Raster based*
|
Scrub
|
|
|
|
Very Dense Forest
|
Mod. Dense Forest
|
Open Forest
|
Total
|
|
|
|
|
Alappuzha
|
1415
|
0.00
|
20.01
|
120.91
|
140.92
|
9.96
|
-0.61
|
0.00
|
|
EranakulamH
|
3063
|
190.46
|
631.53
|
647.02
|
1469.01
|
47.96
|
-2.00
|
0.00
|
|
IdukkiH
|
4356
|
399.27
|
1808.42
|
1003.23
|
3210.92
|
73.71
|
5.06
|
0.54
|
|
KannurH
|
2961
|
57.64
|
493.12
|
1281.33
|
1832.09
|
61.87
|
28.66
|
0.10
|
|
KasaragodH
|
1989
|
0.38
|
241.29
|
896.36
|
1138.03
|
57.22
|
36.16
|
0.08
|
|
KollamH
|
2483
|
10.35
|
484.39
|
701.84
|
1196.58
|
48.91
|
12.12
|
0.00
|
|
Kottayam
|
2206
|
73.71
|
406.62
|
863.44
|
1343.77
|
60.91
|
-7.10
|
0.85
|
|
KozhikodeH
|
2345
|
142.16
|
415.56
|
1324.34
|
1882.06
|
80.26
|
8.87
|
6.75
|
|
MalappuramH
|
3554
|
406.21
|
617.79
|
1140.83
|
2164.83
|
60.91
|
3.52
|
12.01
|
|
PalakkadH
|
4482
|
164.07
|
1,189.59
|
693.17
|
2046.83
|
45.67
|
23.18
|
0.68
|
|
Pathanamthitta
|
2652
|
104.97
|
635.14
|
616.37
|
1356.48
|
51.15
|
4.23
|
0.15
|
|
ThiruvananthapuramH
|
2189
|
63.49
|
700.46
|
630.52
|
1394.47
|
63.70
|
10.09
|
0.08
|
|
Thrissur
|
3027
|
244.63
|
469.92
|
575.48
|
1290.03
|
42.62
|
10.79
|
0.00
|
|
WayanadH
|
2130
|
183.83
|
1207.98
|
201.53
|
1593.34
|
74.80
|
0.45
|
0.61
|
|
Total
|
38852
|
2041.17
|
9321.82
|
10,696.37
|
22,059.36
|
56.78
|
133.42
|
21.88
|
|
*Area figure calculated without normalization factor.
|
Based on the FSI report 2021, the forest cover inside and outside Recorded Forest Area (RFA) has been analysed in different categories and presented. The details are given here.
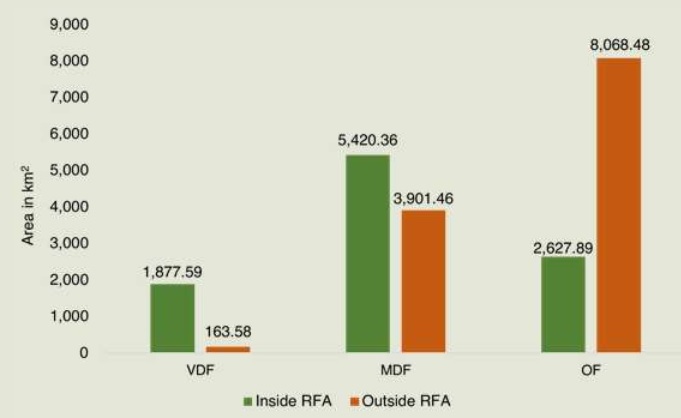
Based on the FSI report 2023, the forest cover inside and outside Recorded Forest Area (RFA) has been analysed in different categories and presented. The details are given below:
|
Forest Cover Inside and Outside Recorded Forest Area (or Green Wash) in Kerala (km2)
|
|
Forest Cover Inside the Recorded Forest Area
(or Green Wash)
|
Forest Cover Outside the Recorded Forest Area
(or Green Wash)
|
|
VDF
|
MDF
|
OF
|
TOTAL
|
VDF
|
MDF
|
OF
|
TOTAL
|
|
1,877.59
|
5,420.36
|
2,627.89
|
9,925.84
|
163.58
|
3901.46
|
8068.48
|
12,133.52
|
|
18.91%
|
54.61%
|
26.48%
|
1.35%
|
32.15%
|
66.50%
|
|
*in case of Kerala, RFA boundaries have been used
|
Forest Cover Inside & Outside of RFA in Kerala
Based on the FSI report 2021, the forest cover change matrix and Altitude-wise Forest Cover in Kerala 2021 are given here.
Based on the FSI report 2023, Forest Cover Change Matrix Inside RFA/GW for Kerala between 2021 Raster based and 2023 Assessments.
|
Class
|
2023 Assessment inside RFA/GW (km2)
|
Total ISFR 2021 inside RFA/GW Raster based*
|
|
VDF
|
MDF
|
OF
|
Scrub
|
NF
|
|
VDF
|
1,877.48
|
0.00
|
0.29
|
0.00
|
1.16
|
1,878.93
|
|
MDF
|
0.00
|
5,415.28
|
0.54
|
0.00
|
14.07
|
5,429.89
|
|
OF
|
0.00
|
0.00
|
2,564.24
|
0.00
|
14.55
|
2,578.79
|
|
Scrub
|
0.00
|
0.00
|
0.39
|
19.60
|
0.14
|
20.13
|
|
NF
|
0.11
|
5.08
|
62.43
|
0.43
|
1,579.20
|
1647.25
|
|
Total ISFR 2023 inside RFA/GW
|
1,877.59
|
5,420.36
|
2,627.89
|
20.03
|
1,609.12
|
11,554.99
|
|
Net Change
|
-1.34
|
-9.53
|
49.10
|
-0.10
|
-38.13
|
|
|
*Area figure calculated without normalization factor.
|
Based on the FSI report 2023, Forest Cover Change Matrix Outside RFA/GW for Kerala between 2021 Raster based and 2023 Assessments.
|
Class
|
2023 Assessment outside RFA/GW (km2)
|
Total ISFR 2021 inside RFA/GW Raster based*
|
|
VDF
|
MDF
|
OF
|
Scrub
|
NF
|
|
VDF
|
163.58
|
0.00
|
0.10
|
0.00
|
0.32
|
164.00
|
|
MDF
|
0.00
|
3,895.37
|
0.22
|
0.00
|
28.20
|
3,923.79
|
|
OF
|
0.00
|
0.03
|
7,873.35
|
0.00
|
77.16
|
7,950.54
|
|
Scrub
|
0.00
|
0.00
|
0.06
|
1.79
|
0.27
|
2.12
|
|
NF
|
0.11
|
6.06
|
194.75
|
0.06
|
15,055.69
|
15,256.56
|
|
Total ISFR 2023 inside RFA/GW
|
163.58
|
3901.46
|
8,068.48
|
1.85
|
15,161.64
|
27,297.01
|
|
Net Change
|
-0.42
|
-22.33
|
117.94
|
-0.27
|
-94.92
|
|
|
*Area figure calculated without normalization factor.
|
|
Altitude – wise Forest Cover in Kerala (km2)
|
|
Altitude Zone (m)
|
Calculated Area by Sol
|
VDF
|
MDF
|
OF
|
Total
|
Scrub
|
|
0-500
|
28,678.00
|
214.45
|
5,088.05
|
8,986.68
|
14,289.18
|
9.45
|
|
500-1000
|
6,478.00
|
873.19
|
2,862.37
|
1,243.20
|
4,978.76
|
8.45
|
|
1000-2000
|
3441.00
|
903.44
|
1,307.31
|
458.79
|
2,669.54
|
3.98
|
|
2000-3000
|
255.00
|
50.09
|
64.09
|
7.70
|
121.88
|
0.00
|
|
Total
|
38,852.00
|
2,041.17
|
9,321.82
|
10,696.37
|
22,059.36
|
21.88
|
|
(based on SRTM, Digital Elevation Model, 30m, 2016).
|
|
Forest Cover in Different Slope Classes in Kerala (km2)
|
|
Slope
(in degrees)
|
Calculated Area by Sol
|
VDF
|
MDF
|
OF
|
Total
|
Scrub
|
|
0-5
|
17,923.00
|
177.42
|
2,164.92
|
4,247.58
|
6,589.92
|
6.39
|
|
5-10
|
8,347.00
|
283.43
|
2,205.86
|
2,774.37
|
5,263.66
|
3.85
|
|
10-15
|
4,607.00
|
337.44
|
1,667.26
|
1,513.40
|
3,518.10
|
2.33
|
|
15-20
|
3,051.00
|
351.72
|
1,238.95
|
964.10
|
2,554.77
|
2.50
|
|
20-25
|
2,137.00
|
319.95
|
908.20
|
594.04
|
1,822.19
|
2.71
|
|
25-30
|
1,402.00
|
246.35
|
600.32
|
343.87
|
1,190.54
|
2.30
|
|
>30
|
1,385.00
|
324.86
|
536.31
|
259.01
|
1,120.18
|
1.80
|
|
Total
|
38,852.00
|
2,041.17
|
9,321.82
|
10,696.37
|
22,059.36
|
21.88
|
|
(based on SRTM, Digital Elevation Model, 30m, 2016).
|
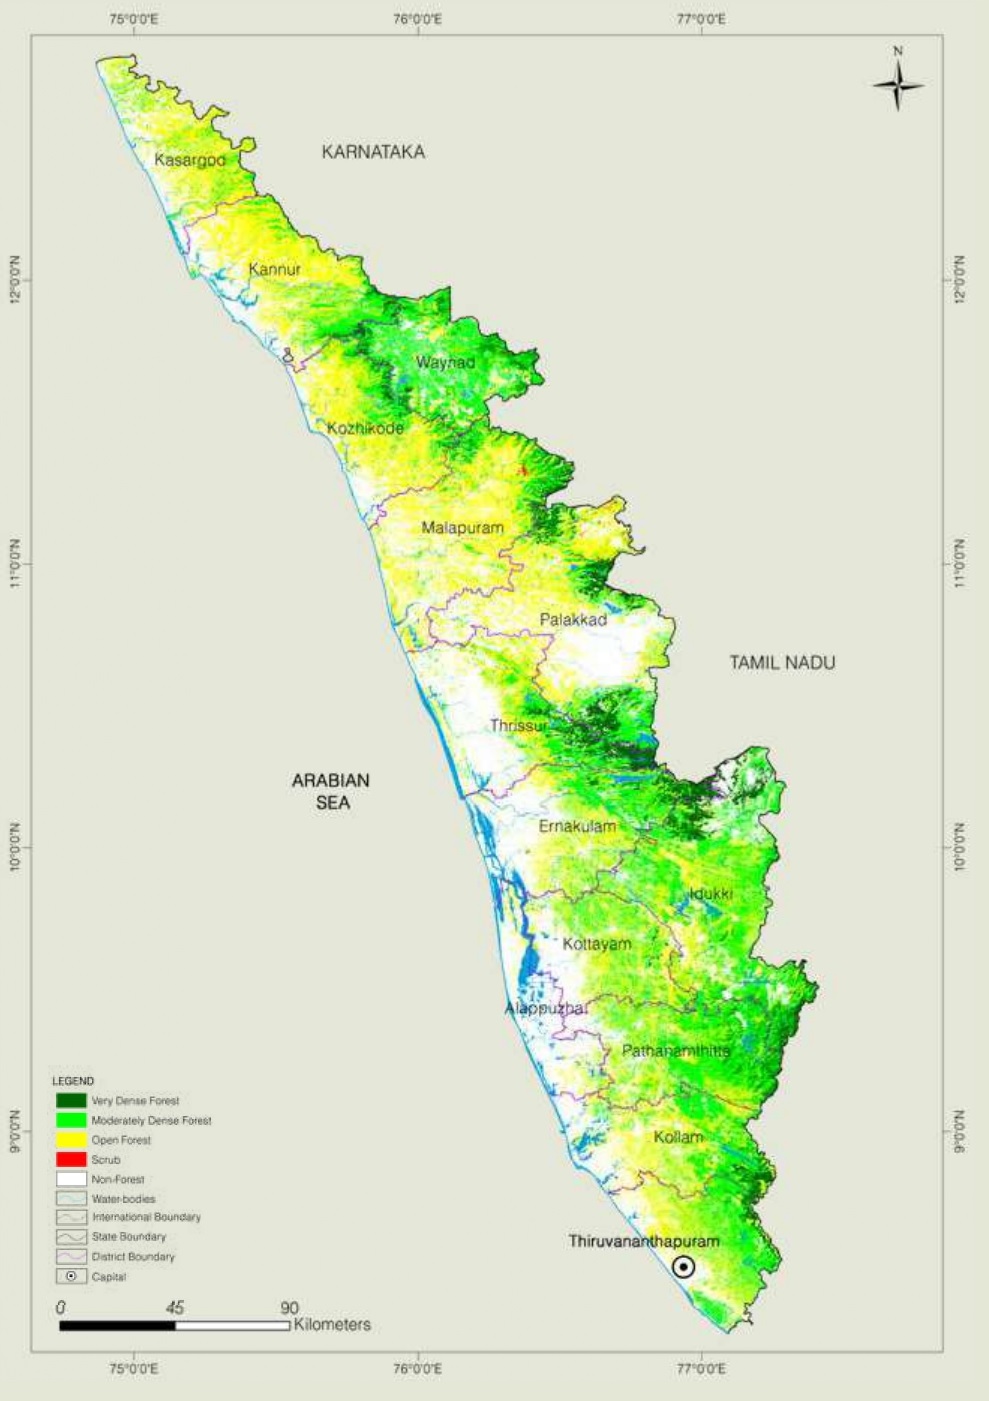
Forest Cover Map of Kerala
District-wise number of forest fire directed by FSI using SNPP-VIIRS sensors (This includes large, continuous and repeated forest fires) during the fire season 2022-23 & 2023-24.
|
District–wise Number of Forest Fire Detected
|
|
Sl.No
|
District
|
SNPP-VIIS Detection during 2022-23
|
SNPP- VIIRS Detection during 2023-24
|
|
1.
|
Alappuzha
|
0
|
0
|
|
2.
|
Ernakulam
|
16
|
25
|
|
3.
|
Idukki
|
449
|
570
|
|
4.
|
Kannur
|
14
|
9
|
|
5.
|
Kasaragod
|
3
|
1
|
|
6.
|
Kollam
|
37
|
47
|
|
7.
|
Kottayam
|
52
|
21
|
|
8.
|
Kozhikode
|
6
|
0
|
|
9.
|
Malappuram
|
95
|
74
|
|
10.
|
Palakkad
|
544
|
250
|
|
11.
|
Pathanamthitta
|
54
|
58
|
|
12.
|
Thiruvananthapuram
|
14
|
12
|
|
13.
|
Thrissur
|
182
|
6
|
|
14.
|
Waynad
|
84
|
37
|
|
15.
|
Total
|
1,550
|
1,110
|
District-wise number of forest fire directed by FSI using SNPP-VIIRS sensors (This includes large, continuous and repeated forest fires) during the fire season 2022-23 & 2023-24.
|
Forest Fire Prone Classes (km2)
|
|
Sl.No
|
Forest Fire Prone Classes
|
Forest Cover*
|
% of Total Forest
|
|
1.
|
Extremely fire prone
|
0.00
|
0.00
|
|
2.
|
Very highly fire prone
|
62.13
|
0.28
|
|
3.
|
Highly fire prone
|
513.06
|
2.32
|
|
4.
|
Moderately fire prone
|
1,322.05
|
5.99 9
|
|
5.
|
Less fire prone
|
20,184.00
|
91.41
|
|
Total
|
22,081.24
|
100.00
|
|
* Forest Cover including Scrub.
|
Forest Cover in different Forest Groups
Forest type mapping using satellite data was carried out by Forest Survey of India with reference to Champion and Seth Classification. As per this assessment, the state has 13 forest types which belong to the seven forest type groups, viz, Tropical Wet Evergreen, Tropical Semi Evergreen, Tropical Moist Deciduous, Littoral and Swamp, Tropical Dry Deciduous, Tropical Thorn and Montane Wet Temperate Forests. Percentage wise distribution of forest cover in different forest type groups found in the state is given in the pie diagram,
Tree Cover: Tree cover of the state over a period of 6 years i.e. 2004-10. The estimated tree cover in the state is 2755km2 which is 7.09% of the geographical area of the state. Five districts of the state namely Ernakulam, Idukki, Kollam, Palakkad, Wayanad have been inventoried. The forest and tree cover of the state is given here.
According to the FSI report 2015, the total tree cover of Kerala is 2951 sq km which is 7.59% of total geographic area of the state. The state having maximum tree cover area is Maharashtra (9558 sq km) followed by Jammu and Kashmir (8354 sq km). Based on the FSI report 2021, the tree cover in Kerala is given here.
Based on the FSI Report 2023, the tree cover in Kerala is given below:
|
Tree Cover in Kerala (in sq km)
|
|
2021 Assessment
|
2023 Assessment
|
Change wrt 2021 Assessment
|
|
2,820
|
2905.94
|
85.94
|
Natural Forest
The forest of Kerala is mainly classified into 5 major categories. The coverage of the plantations forestry is to the extent of 13.5 percent of the total area. There are considerable variations in forest type, the predominant three broad types being tropical moist deciduous forests from the plains to 750 MSL, tropical wet evergreen forests in the mountain ranges of ghats and tropical semi evergreen forests between these two types. These three types together cover most of the natural forest area. Accoring to the FSI reports 2009, the coverage of the plantations forestry is to the extent of 29.97% of the total area. The major types of forests in Kerala during 2009 are given in the table below. The major types of forests in Kerala during 2011 is given here.
Forest Produce
Major forest produce include timber, reeds, bamboo, sandal wood and fire wood. The quantity of timber production in 2009-10 was 51665.6 cum (round log). The number of bamboos and reeds produced were 6.96 lakh and 148.55 lakh respectively. Bamboo production is decreased by 63.3% over the previous year. The sandal wood production was 51120.7 kg. Sandal wood production shows an increasing trend which accounts 65.9% increase over the previous year. There are spices which can be promoted under farm forestry with people participation. The forest policy of the state is guided by the 1988 National Forest Policy. In Kerala the strategies adopted for the development of forests envisages maintenance of environmental stability through preservation and reduction of degraded forests, conservation of biodiversity, increasing productivity of forest, increasing substantially the forest cover through massive afforestation and developing participatory forest management. A comprehensive state forest policy to address the specific problems and issues related to the conservation of forests and biodiversity of the state as well as the livelihood needs of the forest development communities has been formulated during 2007. The Forest Management Policy of the state encompasses technology improvement, biodiversity conservation and development of partnership with the forest dependent communities and fringe dwellers. Special thrust is also given for protecting species of plants and animals.
Timber and Non-Timber forest products of Kerala
Forest Products collection is one of the major livelihoods of the local people. It consist of a variety of products, which are sources of food, fibre, manure, construction materials, cosmetics and cultural products. The users of NTFP range from local individuals to multinational companies. With the development of modern techniques, the number of products and uses based on NTFP has increased by many folds. Studies indicate NTFP collectors are amongst the lowest-income groups in India, often receiving a mere 5-20% of the value for their products (SPWD,1993). About 69% of the forest based employment is related to NTFP. The forests of Kerala are very rich in NTFP including edible products, medicinal plants, toiletries, tans, dyes, gums, resins, rattan, bamboo, grasses and animal products. Although 500 species of NTFP are available in the forests of Kerala, about 120 items are listed as commercially important by the Kerala Forest Department. But as per record more than 200 species are being collected is given here
The quantity of timber production in 2011-12 was 17283.23 cum (round log). The number of bamboos and reeds produced were 4.66 lakh and 93.91 lakh respectively. The sandal wood production was 52104.08 kg. The trend in production of forest produces from 2001-02 to 2011-12 (provisional) are shown here. The forest policy of the state is guided by the 1988 National Forest Policy. In Kerala the strategies adopted for the development of forests envisages maintenance of environmental stability through preservation and reduction of degraded forests, conservation of bio-diversity, increasing productivity of forest, increasing substantially the forest cover through massive afforestation and developing participatory forest management. A comprehensive state forest policy to address the specific problems and issues related to the conservation of forests and biodiversity of the state as well as the livelihood needs of the forest development communities has been formulated during 2007. The Forest Management Policy of the state encompasses technology improvement, bio-diversity conservation and development of partnership with the forest dependent communities and fringe dwellers. Special thrust is also given for protecting species of plants and animals.
Status of Natural Forests VERSUS Plantations
The oldest teak plantation of India was raised in Nilambur of Kerala State during 1840s. About 20,000 ha area was brought under teak till 1960. Although regular plantation activity started during the second five year plan, greater momentum was achieved after 1980s. During 1980 to 1985, a total of 1,17,630 ha of area was under plantations of different species and this was increased to 3,10,830 ha in 1985-1990. Later on, the trend reversed and there was decline in plantation area to 85,300 ha in 1990-95 and to 1,03,750 ha in 1995-2000 (Table 1.5). Presently only the existing areas under plantations are managed and no more natural forest area is converted into plantation. The trend in reduction in establishment of plantation and current strategy of non-conversion of natural forests into plantation is a positive indication towards sustaining the status of the natural ecosystem which in turn also improves the indigenous biodiversity of the State.Table 1.5. Forest Plantations Raised by Different Agencies since 1951
Joint Forest Management (JFM):The participation of village communities living close to natural forests for the protection and development of forests has been given emphasis in the National Forest Policy, 1988. Accordingly, at National level, during 2001-2003, a total of 173319.60 km2 of forest area was brought under the scheme with the involvement 84,632 committees. Almost all the States in the country have implemented the programme. The notification to the State Governments to involve local communities in the management of forests was issued by the Government of India in June, 1990. It is envisaged that the communities, in lieu of their participation in protection and development of forest areas, will be entitled for sharing the usufructs in a manner specified by the concerned forest departments. This has led to the development of the Joint Forest Management (JFM) programme.
The notification for Participatory Forest Management (PFM) was issued by Kerala Government in January, 1998 [GO (MS) 8/98/F&WLD dated 16.1.1998] and guidelines for implementation of PFM was issued in July, 2006 [GO (MS) No. 26/06/F&WLD dated 20.07.2006). There has been a progressive growth in the number of committees and the area brought under the scheme since 1999. Presently, more than 173 km2 of Kerala forests is covered under the scheme (Table 1.6) with the involvement of 598 committees from an area of 4 km2 and 21 committees in 1999. Table 1.6. Progress of Participatory Forest Management in Kerala
Accordingly, a paradigm shift is happening in the field of forest and wildlife management and the new strategy tries to reconcile the multiple demands on forests and to conserve the biodiversity on one hand and to meet the demands of the society on the other. The idea of involving local communities in forest conservation emerged out of this. It is a realization of the fact that governments enjoy political, legislative, judicial and financial powers to exert their will, rural communities have numeric superiority, a strong vested dependency and a strategic geographic position in relation to the forest resources. As a participatory forest management strategy for Protected Areas, ecodevelopment aims at conserving the biodiversity by addressing both the impact of local people on the Protected Areas and the impact of the Protected Areas on local people. Cardamom for Rainforest Conservation (CRC) and Participatory Forest Management (PFM) are processes initiated by the Forests and Wildlife Department of the State to protect the Cardamom Hill Reserves with the participation of Cardamom growers, Forest Department and related scientific organizations. The micro level organization associated with this is called the Unit Level Organization (ULO). In response to the changed paradigm of partnership, Eco Development Committees (EDCs) were established around fourteen Protected Areas of Kerala through village level planning of reciprocal commitments. The reciprocity resides in the mutual quid-pro-quo of specific measurable actions by local people to improve conservation and project investments that foster alternative resource use and livelihood. The intervention of these social institutions formed along the fringe areas of the forests of Kerala indicates that the novel approach adopted for building bridges between people and the forest management are paying dividends with regard to the long term conservation of forested areas and in the overall social capital built up in the communities.
Formation of these institutions has resulted in reducing the depletion of natural resources, to improve the socio-economic conditions of the marginalized communities and the consolidation and creation of social capital within individuals and society. This is now used as a platform for grass root level planning, asset creation, conflict resolution, networking other agencies and the formation of sub and satellite institutions. Currently, there are 598 units in PFM, including 304 fringe VSSs (Vana Samrakhana Samithis), 68 tribal VSSs, 33 ULOs and 193 EDCs. The number of VSSs also recorded overall increase during 1999-2000 to 2004-2005 (Table 1.7) and then declined in the subsequent years (Figure 1.4). Forest Development Agency (ULO/FDA) registered under Society Act has now become a division–level subsisiary of VSSs and EDCs, and funds to VSSs for developmental activities from various departments and the central government are chanelled through FDA. Now FDAs cover an area of 15,840 ha in Kerala. Table 1.7 Year wise Constitution of VSSs by the Wildlife Wing of Kerala Forest Department since 1999 & Figure 1.4 Year wise Constitution of VSSs by the Wildlife Wing of Kerala Forest Department since 1999
Compensatory Afforestation Programme
As per GO(MS) 11/94/F&WLD dated 17-03-1994, Compensatory Afforestation Programme was initiated at an estimated cost of Rs.113 crores, to be executed within a period of 10 years, starting from the financial year 1993-94. The target of the scheme was afforestation of 57,180 ha of forest land in lieu of 26,588 ha lost by way of encroachments prior to 01-01-1977 , which was a pre-condition for obtaining Government of India clearance for issuing PATTA to the encroached land. Though the programme of compensatory afforestation was scheduled to commence from 1993-94, it could take off only from the financial year 1994-95. As per the approval of the project, treatment and afforestation of 57,180 ha of degraded forests had to be completed by 1998-99 and the areas maintained for another 5 years, i.e., till 2002-03. But the treatment and afforestation of the entire area could not be completed as expected by 1998-99 and even at the end of 2001-02, due to various administrative and technical constraints. The progress in both physical and financial components of the programme, achieved till 2001-02, is given in Table 1.8. Out of the total targeted area of 57,180 ha under the scheme aportioned year-wise to be accomplished, hardly 20 percent could be achieved till 2002-03 at a cost of rupees 57.80 crores which is almost 53 percent of the total allotment. Therefore, both the physical and financial targets envisaged under the scheme could not be achieved which indirectly indicates the ineffectiveness of the programme as far as the State of Kerala is concerned. Whether it is due to lack of availability of proper resources, constraints in identifying targeted area, problems in the field implementation of the programme or administrative constraints is not known. The ecological suitability of the species tried in the programme, the survival rate of planted propagules, etc. are also matters of concern. Therefore even though the programme is a positive step taken by the Government of India to improve the status of the forest ecosystem and also to enrich the biodiversity of degraded areas, the success of it is not satisfactory, till date.
The National Afforestation Programme is now being implemented through a two-tier mechanism of Forest Development Agencies (FDA) at Forest Division level and Joined Forest Management Committees (JFMCs) at the village level. Currently, Kerala has 23 FDA project proposals from April 2000 onwards with a total estimated cost of Rs.47.44 crores covering an area of 15,840 ha (MoEF, 2006). Table 1.8. Details of Compensatory Aforestation Activity in Kerala during 1993-94 to 2002-2003
Extent of Protected Areas (PAs)
Protected areas are established in the country for the IN SITU conservation of biodiversity at ecosystem level. The current number of protected areas in India includes 92 National Parks and about 500 Wildlife Sanctuaries. At present, there are 13 Wildlife Sanctuaries (including two Bird Sanctuaries) and five National Parks in Kerala (Table 1.10), covering a total area of 2,346.33 km2 (KFD, 2004). Parts of two Biosphere Reserves, namely Nilgiri Biosphere Reserve with an extent of 1455.40 km2 and the newly proposed Agasthiyavanam Biosphere Reserve with an area of 1701 km2 in Kerala are also protected areas within the State to preserve the forests and biodiversity. The increase in the number and area of National Parks and Wildlife Sanctuaries in the State is given in here. Including Biosphere Reserves, a total area of about 5,502.78 km2 is under the protected area network, which comes to about 14 percent of the geographic area of Kerala. Details of National Parks and Wildlife Sanctuaries in Kerala as on 31.03.2004 is given here, it is clear that there are only 21.638 km2 of National Park area and 32 km2 of Wildlife Sanctuary area were added to the protected area network of the State since 1985, and that too only during 2006.
Project Tiger programme was launched during 1973 to conserve the wild populations of the species in the country. The programme is spread over different States of which 777 km2 is in Kerala. It was launched in the State in Thekkady Wildlife Sanctuary during 1978 to preserve Tiger and its prey base and the habitat. The programme is successful and recent wildlife census shows that the number of tigers in the State has increased substantially. A similar project on elephant called Project Elephant was launched in 1991 aimed at conservation of elephant through protection and management of their habitat range. The elephant reserves identified in Kerala include Wayanad, Nilambur, Animudi and Periyar.
► Bamboos of Western Ghats / ► National Afforestion Programme (NAP) / ► Endangered Forest Species in Kerala / ► Tribal Settilements in Kerala ► Forest Cover Dynamics of Kerala
Source : (i) PFM Cell, Forests and Wildlife Department, Kerala State (KFD 2004,2006)
(ii) FSI 2009-2023
(iii) Economic Review 2010-2023