Land
Kerala is endowed with a combination of distinct altitudinal variations resulting from the rise of the land mass from 5 meters below sea level in the west to the soaring heights of 2695 meters in the east within the short span of 120 km. The small expanse of land with an area of 38,863 km2 has a base length of 560 km along the coast and width ranging from 11 km to 124 km. Physiographically, the terrain has three natural regions namely, lowlands, midland, highlands (Figure 1). Geologically, Kerala is occupied by four major rock formations namely, crystalline rocks of Precambrian age, sedimentary rocks of Tertiary confined to Neogene period , laterites capping the crystalline and sedimentary rocks and recent and sub recent sediments forming the low-lying areas and river valleys. There are sporadic Paleozoic granites and pegmatite and Meso-Cenozoic dykes intruding these rocks. The oldest rocks so far dated in Kerala are the charnockites, which yielded an age of 2930 +/- 50 Ma (Soman, 1997& 2002). The varied rock formations under different geological domains harbour different mineral deposits and the transformed rock strata stockpile copious groundwater resource. The state is gifted with ten soil types derived from the laterite base and has 12 distinct agro climatic zones. The undulating topography, vibrant climate and vivacious hydrology in the background of ever active tectonics resulted in 44 river basins, 1750 sub basins and 4452 mini watersheds providing multitudes of lively micro ecosystems. The environment of these micro watersheds are conducive to varying crop types, such as, coconut and rice in the sultry lowlands, rice, tapioca, banana, arecanut, coconut, pepper, cashew and rubber in hot humid midlands and tea, coffee and cardamom in the cool subtropic highlands. The micro ecosystems are such that the valleys with near waterlogged conditions for most part of the year are seen juxtaposed with dry hilltops decked with densely canopied trees.
| Physiographic units, altitudes and areas |
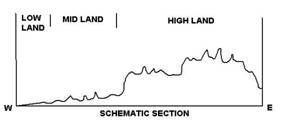
Figure 1
|
| Unit |
Altitude (m)
|
Area (Km2)
|
Area(%)
|
| Lowland |
0 - 7.5 |
3979.3 |
10.24 |
| Midland |
7.5 - 75 |
16231.2 |
41.76 |
| Highland |
> 75 m |
18653.5 |
48.00 |
| |
Physiographic map of Kerala
Land capability
Considering the characteristics of soil, drainage/wetness, erosion, runoff etc., Kerala has 18 land capability subclass associations of five broad land capability (LC) classes (KSLUB, 1995 and 2002). The broad LC classes are Class II (Good cultivable land), Class III (Moderately good cultivable land), Class IV (Fairly good cultivable lands), Class VI (Well suited for forestry or grazing), and Class VIII (Land suited only for wildlife and recreation). The approximate area under each class is given here. The soil of Kerala has limitations for sustained use under irrigation. Only about 37% of the area of Kerala is suitable for irrigation with certain limitations.
Land use
Kerala has a diverse land use and cropping pattern. The land reforms introduced in the State brought in radical and comprehensive institutional changes leading to drastic transformation in the land holding pattern. This has resulted in shift in the land use pattern. Agriculture is the dominant land use type of the State. It accounts for over 55% of the geographical area followed by forest land (including degraded forest) of 28% but area under non-agricultural use is only 11% (Farm Guide, 2006).Classification of area under land utilization for the year 2006-2007.
The land use pattern of Kerala during 2009-10 reveals that out of a total geographical area of 38.86 lakh ha. net sown area is about 56 percent. Forest occupies around 28 percent. Agriculture and forest sectors together account for over 84 percent of the land area. The net sown area has increased by 4.39 percent while the total cropped area has declined by 0.97 percent. Land under non-agricultural uses was 9 percent in 1999-00 and has increased to 9.68 percent in 2008-09 and it slightly declined to 9.31 percent in 2009-10. There was an increase in the area under current fallow (9186 ha) and a decrease in the area under fallow other than current fallow (581 ha) during 2009-10 over 2008-09. The area under cultivable waste increased by 1821 ha. and barren and uncultivated land declined by 7019 ha.
Data on land use pattern of Kerala for the year 2010-11 is given below. Out of a total geographical area of 38.86 lakh ha. net sown area is about 53 percent. Forest occupies around 28 percent. The net sown area has declined slightly by 0.35 percent. The share of total cropped area in the total geographical area is 68 percent. But it marked a decline of 21217 ha during 2010-11 over the previous year. The share of land under non-agricultural uses out of total geographical area was 9 percent in 2009-10 and has increased to 10 percent in 2010-11. There was a decline in the area under current fallow (917 ha) and increase in the area under fallow other than current fallow (6569 ha) during 2010-11 over 2009-10. The area under cultivable waste declined 6349 ha and barren and uncultivated land declined by 2473 ha. The land use pattern in Kerala during 2010-11 is given here. The data on land use pattern of Kerala for the year 2011-12 is given here.
Out of a total geographical area of 38.86 lakh ha. net sown area is about 53 percent. The net sown area has declined by 1.5 percent in the current year over 2010-11. The share of total cropped area in the total geographical area is 68 percent. It marked an increase of 14296 ha during 2011-12 over the previous year while the net area sown declined by 31375 ha over the previous year. The share of land under non-agricultural uses out of total geographical area is 10 per cent in 2011-12. There is an increase in the area under current fallow (1028 ha) and increase in the area under fallow other than current fallow (5727 ha) during 2011-12. The area under cultivable waste also increased by 3772 ha and barren and uncultivated land declined by 2021 ha. The land use pattern of Kerala during 2011-12 is given here.
Out of a total geographical area of 38.86 lakh ha, one fourth was under forests, and one tenth of it was put to non agricultural use. Also, while the net sown area which accounts for 53 percent of the total area, did not record any significant changes, the area sown more than once which accounted for 14 percent of the total geographical area recorded a notable decline of 13 percent from 6.2 lakh ha to 5.4 lakh ha in 2012-13. As a result, the gross cropped area registered a decline of 3 percent. One notable feature is the decline in the area of barren and uncultivated land and an increase in permanent pastures and grazing land which although accounts for only 0.003 percent of the total geographical area registered a sharp increase of 39 percent in 2012-13. Numerical and graphical representaiton of land use pattern for the year 2012-13 is shown here. The land use pattern in Kerala 2012-13 is given here.
The data on land use pattern for the year 2013-14 is given here. Out of a total geographical area of 38.86 lakh ha, little above one fourth was under forests, and one tenth of it was put to non agricultural use. Also, while the net sown area which accounts for 53 percent of the total area, did not record any significant changes, area sown more than once which accounted for 15 percent of the total geographical area recorded a notable increase of 4 percent from 5.4 lakh ha in 2012-13 to 5.65 lakh ha in 2013-14. As a result, contrary to the previous year the gross cropped area registered an increase of 1 percent. Another notable feature is the decline in the area of barren and uncultivated land by 17 percent, of permanent pastures and grazing land by 93 percent and the area under current fallow by 8 percent. The land use pattern in Kerala 2013-14 is shown here.
Data on land use pattern for the year 2014-15 is given in PDF. Out of a total geographical area of 38.86 lakh ha, little over one fourth was under forests, and one tenth of it was put to non agricultural use. Also, the net sown area which accounts for 53 percent of the total area, did not record any significant changes. Area sown more than once, which accounted for 15 percent of the total geographical area recorded a notable increase of 3 percent from 5.65 lakh ha in 2013-14 to 5.81 lakh ha in 2014-15. As a result, the gross cropped area registered a minor increase of 0.3 percent. Another notable feature is the decline in the area of barren and uncultivated land (-5 per cent), permanent pastures and grazing land (-38 per cent) and the area under current fallow (- 8 per cent). The land use pattern in Kerala 2014-15 is shown here
The total geographical area is classified according to thirteen different uses of land as shown here
The cultivated area of the state comes to around 67.6 per cent of the total geographical area. Within this, the Net Sown Area accounts for 52 per cent and 16.83 per cent of the cultivated area is sown more than once. More than one-fourth of the area is under forest cover and 11.18 per cent of the area is put to non-agricultural use. On the other hand, there was a 4 per cent increase in the area put to non-agricultural uses and a 7 per cent increase in the land under fallow. The land use pattern in Kerala 2015-16 is given here
However, if the total area is further regrouped into two major categories: 'land that is available for cultivation' (including net sown area, cultivable waste, current fallow, fallow other than current fallow and land under miscellaneous tree crops) and 'land not available for cultivation' (which includes land put to non-agricultural use, barren and uncultivable land and permanent pastures and other grazing land besides forest area). In that case it can be seen that land that is available for cultivation comes to 57.9 percent of the total geographical area. The current Net Sown Area is 52 percent of the total geographical area. Thus most of the land that is available for cultivation is already under cultivation. Hence the scope of bringing more area under cultivation is marginal and increase in agriculture production can be achieved mainly through increasing the productivity of crops.
The net area under cultivation during the year 2016-17 was 20,15,482 Ha. The total cropped area during the year 2016-17 was 25,84,00 Ha. The land use pattern in Kerala 2016-17 is given here .
The total cropped area of the State has been declining consistently, from 30 lakh hectares in 2000 to 25.84 lakh hectare in 2016-17. Net sown area has recorded a slight decline of 8.64 percent, and the area sown more than once has declined by 30.29 percent. Current fallows have decreased 7.5 per cent whereas the "fallows other than current fallows” as well as “cultivable waste land" have recorded an increase of 63.38 per cent and 71 per cent respectively. Thus the land that is available for cultivation but is not being cultivated is on the rise signalling the tendency of people to keep land fallow for various reasons.
The land utilisation statistics of Kerala show that in 2016-17, out of the 38.86 lakh hectare of geographical area, the total cropped area was 25.84 lakh hectares (66 per cent), area under forest was 28 percent, and land put to non agriculture uses accounted for 11 percent. Cultivable waste and fallow land constituted 3 percent each. Year on year there has been a 2 percent decline in the gross cropped area. This is mainly due to factors like decline in area sown more than once, diversion of economic activity from agricultural operations to non-agricultural operations due to high input prices and labour cost, shift in cropping pattern skewed towards cash crops, etc. The land use Pattern in Kerala (Area in Ha) during 2016-17 is given here
As per the land use data of 2017-18, out of a total geographical area of 38.86 lakh ha, total cultivated area is 25.79 lakh ha (66 per cent) and the net area sown is 20.40 lakh ha (52 per cent). Land put to non-agricultural use stands at 11 percent and forest area is 28 per cent. The cultivable waste and current fallow constituted 3 and 2 per cent respectively. As compared to 2016-17, there is a decline in area under barren and uncultivated land, cultivable waste, fallow other than current fallow and current fallow by 8 per cent, 5 per cent, 11 per cent and 20 per cent respectively. The land use pattern is given here.
Kerala has witnessed major changes in its land use pattern over the years. The major change being the shift from cultivation of food crop to nonfood crops and increase in area under nonagricultural use. Changes in land use and cropping pattern in Kerala pose a challenge not only to food security but also to the ecological sustainability of the State. An analysis of changes in land use pattern over a period helps us to comprehend the present scenario of agricultural land utilisation. Data on land use pattern for the year 2018-19 is given here.
As per the land use data of 2018-19, out of a total geographical area of 38.86 lakh ha, total cultivated area is 25.68 lakh ha (66 per cent) and the net area sown is 20.44 lakh ha (53 per cent). Land put to non-agricultural use stands at 12 per cent and forest area is 28 per cent. The cultivable waste and current fallow constituted 2 and 1 per cent respectively which is lower than 3 per cent and 2 per cent in 2017-18. As compared to 2017-18, there is a decline in area under barren and uncultivated land, fallow other than current fallow and current fallow by 5.6 per cent, 8 per cent and 0.1 per cent respectively. The net area sown increased by 0.2 per cent.
The total cropped area and area-sown more than once declined by 0.4 per cent and 3 per cent respectively. This decline in total cropped area and area sown more than once may be due to the deluge that hit the State in 2018-19. The land put to non-agricultural uses has increased by 3 per cent. The land use pattern is given here.
As per the land use data of 2019-20, out of a total geographical area of 38.86 lakh ha, total cultivated area is 25.89 lakh ha (66.64 percent) and the net area sown is 20.26 lakh ha (52.13 percent). Land put to non-agricultural use is 11.73 percent and forest area is 27.83 percent. The cultivable waste and current fallow constituted 2.57 percent and 1.48 percent respectively. An analysis of changes in land use pattern over a period helps to comprehend the present scenario of agricultural land utilisation. Data on land use pattern for the year 2019-20 is given here.
Compared to 2018-19, there is increase in area under barren and uncultivated land, land under miscellaneous tree crops, land put to non-agricultural uses, cultivable waste and fallow lands other than current fallow by 3.29 percent, 1.18 percent, 0.41 percent, 3.43 percent and 3.05 percent, respectively. The area under cultivable waste increased by 3,313 ha and fallows other than current fallow by 1390 ha. The net area sown decreased by 0.37 percent.
The total cropped area and area sown more than once increased by 0.73 percent and 4.92 percent respectively. The cropping intensity increased from 126 per cent to 128 percent. The land use pattern is given here.
The total number of operational holdings in the State has increased from 6,831 thousand in 2010-11 to 7,583 thousand in 2015-16 showing an increase of 11 percent. The average size of operational holding has declined to 0.18 ha in 2015-16 as compared to 0.22 ha in 2010-11 is given here.
As per the land use data of 2020-21, out of a total geographical area of 38.86 lakh ha, total cultivated area is 25.69 lakh ha (66.10 per cent) and the net area sown is 20.35 lakh ha (52.37 per cent). Land put to non-agricultural use is 11.86 per cent and forest area is 27.83 per cent. The cultivable waste and current fallow constituted 2.42 per cent and 1.40 per cent respectively. Compared to the land use pattern of 2019-20, the area under fallow lands, both current fallow and fallow other than current fallow has declined by 5.5 per cent and 8.9 per cent respectively. The area under cultivable waste also declined by 5.9 per cent. The cropping intensity decreased from 128 per cent to 126 per cent.
The net area sown increased by 0.45 per cent while the total cropped area declined by 0.68 per cent compared to 2019-20. One of the reasons for the decline in total cropped area could be the decline in the area sown more than once which is 4.7 per cent less than 2019-20. However, there is an increase of 1.1 per cent in the land put to non-agricultural uses and 12.9 per cent increase in land under miscellaneous tree crops. Data on land use pattern for the year 2020-21 is given here. Fig
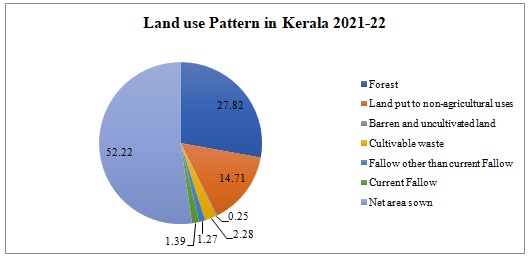
The land use pattern of the State had witnessed drastic changes over the years. Out of the total geographical area of 38.86 lakh hectares of the State, the net sown area was 20.29 lakh ha (52.22 per cent), land put to non agricultural use was 5.72 lakh ha (14.71 per cent) and area under forest was 10.82 lakh ha (27.82 per cent).
The change in agricultural land use is marked by changes in coverage of individual crops and the total cropped area. The total cropped area which was 77 per cent of the total geographical area in 2000-01, has declined to 64.92 per cent in 2021-22. As per the land use data of 2021-22, out of the total geographical area of 38.86 lakh ha, total cultivated area was 25.23 lakh ha (64.92 per cent) and the net area sown was 20.29 lakh ha (52.22 per cent).
Compared to the land use data of 2020-21, the area under cultivable waste and current fallow has declined by 5.83 per cent and 0.63 per cent respectively. But, there has been considerable increase in the area under ‘fallow other than current fallow’ and ‘barren and uncultivated land’ by 15.6 per cent and 2.67 per cent respectively.
The ‘net area sown’ and ‘area sown more than once’ declined by 0.28 per cent and 7.53 per cent respectively. This is reflected in the total cropped area of the State showing a decline of 1.79 per cent in 2021-22. The cropping intensity declined from 126 per cent to 124 per cent in the period of review. The details are given below:
|
Land use Pattern in Kerala (Area in Ha)
|
|
Sl.No
|
Classification of Land
|
2020-21
|
2021-22
|
Percentage of Geographical areas
|
Change in area between 2020-21 and 2021-22
|
|
Actual
|
Percentage
|
|
1
|
Total Geographical Area
|
3886287
|
3886287
|
-
|
-
|
-
|
|
2
|
Forest
|
1081509
|
1081509
|
27.82
|
0
|
0
|
|
3
|
Land put to non-agricultural uses
|
566719
|
571526
|
14.71
|
4807
|
0.85
|
|
4
|
Barren and uncultivated land
|
9529.43
|
9784
|
0.25
|
254.57
|
2.67
|
|
5
|
Permanent Pastures and Grazing land
|
0
|
0
|
0
|
0
|
0
|
|
6
|
Land under miscellaneous tree crops
|
2420.34
|
2267
|
0.06
|
-153.34
|
-6.34
|
|
7
|
Cultivable waste
|
93973.75
|
88499
|
2.28
|
-5474.75
|
-5.83
|
|
8
|
Fallow other than current Fallow
|
42751.7
|
49420
|
1.27
|
6668.3
|
15.6
|
|
9
|
Current Fallow
|
54255.4
|
53914
|
1.39
|
-341.4
|
-0.63
|
|
10
|
Net area sown
|
2035128.32
|
2029368
|
52.22
|
-5760.32
|
-0.28
|
|
11
|
Area sown more than once
|
533831.41
|
493646.31
|
12.7
|
-40185.1
|
-7.53
|
|
12
|
Total cropped Area
|
2568959.73
|
2523014.31
|
64.92
|
-45945.42
|
-1.79
|
|
13
|
Cropping Intensity (%)
|
126.23
|
124.33
|
|
|
|
|
Note: Land put to non agricultural uses includes marshy land, still water, water logged area and social forestry. Source : Department of Economics and Statistics, GoK
|
Source: Economic Review, 2022
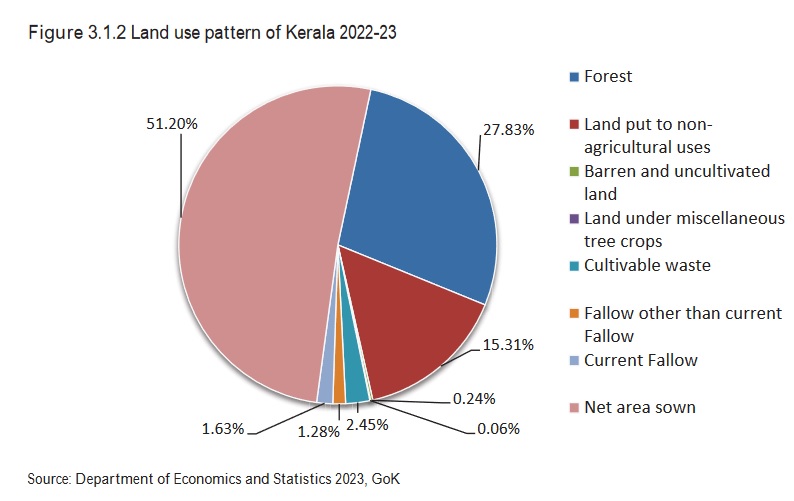
As per the land use data, 2022-23 of the Department of Economics and Statistics, out of the total geographical area of 38.86 lakh ha, total cultivated area was 25.16 lakh ha (64.75 per cent) and the net area sown 19.89 lakh ha (51.20 per cent). Land put to non-agricultural use was 5.95 lakh hectare (15.31 per cent) and area under forests 10.82 lakh hectare (27.83 per cent).
The area under cultivable waste and current fallow reported an increase in 2022-23 by 7.51 per cent and 17.43 per cent respectively as against the decline reported in 2021-22. The area under land put to non-agricultural uses and fallow other than current fallow also recorded an increase. The area under barren and uncultivated land recorded a decline of 3.2 per cent over 2021-22.
The ‘area sown more than once’ recorded an increase of 6.64 per cent as against the decline reported in the previous year. The increase in extent of cultivable waste and current fallow is reflected in the total cropped area showing a decline of 0.27 per cent over 2021-22. Data on land use pattern for the year 2022-23 is given below:

As per the land use data, 2023-24 of the Department of Economics and Statistics, out of the total geographical area of 38.9 lakh ha, total cropped area was 25.4 lakh ha and the net area sown was 19.7 lakh ha. Land put to nonagricultural use was 6.1 lakh ha and area under forest cover was 10.8 lakh ha. The graphical depiction of the land use pattern in Kerala for the year 2023-24 is given below:
Land use pattern of Kerala 2023-24
.jpg)
Detailed data on land use pattern for the years 2022-23 and 2023-24 are given below:
|
Sl No
|
Classification of Land
|
2022-23
|
2023-24
|
Percentage of Geo-
graphical area
|
Change in area between
2022-23 & 2023-24
|
|
Actual
|
Percentage
|
|
1
|
Total Geographical Area
|
3886287
|
3886287
|
|
|
|
|
2
|
Forest
|
1081509
|
1081509
|
27.83
|
|
|
|
3
|
Land put to non-agricultural uses
|
593165.36
|
609575.64
|
15.69
|
16410.28
|
2.77
|
|
4
|
Barren and uncultivated land
|
9474.66
|
9491.1
|
0.24
|
16.44
|
0.17
|
|
5
|
Permanent Pastures & Grazing land
|
0
|
0
|
0
|
0
|
0
|
|
6
|
Land under miscellaneous tree
crops
|
2232.83
|
2050.46
|
0.05
|
-182.37
|
-8.17
|
|
7
|
Cultivable waste
|
95147.35
|
102302.86
|
2.63
|
7155.51
|
7.52
|
|
8
|
Fallow other than current Fallow
|
49951.29
|
51227.44
|
1.32
|
1276.15
|
2.55
|
|
9
|
Current Fallow
|
63313.75
|
57360.78
|
1.48
|
-5952.97
|
-9.40
|
|
10
|
Net area sown
|
1991492.76
|
1972769.72
|
50.76
|
-18723.040
|
-0.94
|
|
11
|
Area sown more than once
|
524430.61
|
563653.50
|
14.50
|
39222.89
|
7.48
|
|
12
|
Total cropped Area
|
2515923.37
|
2536423.22
|
65.27
|
20499.85
|
0.81
|
|
13
|
Cropping Intensity (%)
|
126.33
|
128.57
|
|
|
|
|
Note: Land put to non agricultural uses includes marshy land, still water, water logged area and social forestry
Source : Department of Economics and Statistics, GoK
|
Between 2022-23 and 2023-24, the total cropped area is increased by 0.8 per cent. The area sown more than once is increased by 7.5 per cent in 2023-24 over the previous year. The current fallow showed a decline of 9.4 per cent. But the net sown area of the State registered a decline of 0.9 per cent. The area under cultivable waste land reported an increase in 2023-24 by 7.5 per cent over 2022-23. The area under land put to nonagricultural uses, fallow other than current fallow, and area under barren and uncultivated land also recorded an increase in 2023-24 by 2.8 per cent, 2.6 per cent, and 0.2 per cent respectively.
Sources: Economic Review 2009-2023
SoE Report 2007