Envis Centre, Ministry of Environment & Forest, Govt. of India
Printed Date: Friday, November 15, 2024
Livestock
Cattle, buffalo, goat, pig, poultry, duck are the major live stock population reared in Kerala. In Kerala as per 2003 census nearly 94% of the livestock population is concentrated in the rural area, 80% of the livestock farmers area marginal farmers and agricultural farmers. Women constitute 60% of the workers in this sector. As per 2003 figures,Kerala's share in all India cattle population is 1.13%, buffalo population accounts only for 0.07%, goat 1.01% and pig 0.05%. Cattle population in the state is 21.22 lakh, of which 17.35 lakh were crossbed. Of the total cattle population Palakkad district accounts for 12.4% and Wayanad for 4.89%. Higher number of buffalo population is concentrated in Malappuram district (19%), goat in Thiruvananthapuram (12%) and pig in Idukky (30%). Regarding poultry Malappuram accounts for 13% fowls and Alappuzha accounts for 38% of ducks.
As per 19th Livestock Census 2012, the total livestock population consisting of cattle, buffalo, sheep, goat, pig, horses & ponies, mules, donkeys, camels, mithun and yak in the country is 512.05 million numbers in 2012. The total livestock population has decreased by about 3.33% over the previous census. Livestock population has increased substantially in Gujarat (15.36%), Uttar Pradesh (14.01%), Assam (10.77%), Punjab (9.57%) Bihar (8.56%); Sikkim (7.96%), Meghalaya (7.41%), and Chhattisgarh (4.34%). The total bovine population (Cattle, Buffalo, Mithun and Yak) was 299.9 million numbers in 2012 which shows a decline of 1.57% over previous census. The number of milch animals (in-milk and dry) in cows and buffaloes has increased from 111.09 million to 118.59 million, an increase of 6.75%. There were 65.06 million sheep in the country during 2012, a decline of about 9.07% over census 2007 whereas the Goat population has declined by 3.82% over the previous census and the total Goat in the country was 135.17 million numbers in 2012. The total pigs in the country have also decreased by 7.54% over the previous census and there were 10.29 million pigs during 2012. Horses & ponies population, on the other hand has increased by 2.08% over the previous census with about 0.62 million numbers in 2012. Camel population has decreased by 22.48% since previous census and it stood at 0.4 million in 2012. The total poultry population in the country has increased by 12.39% over the previous census and the total poultry in the country was 729.2 million numbers in 2012. In 19th Livestock Census 2012, 37.28% were cattle, 21.23% buffaloes, 12.71% sheep, 26.40% goats and 2.01% pigs.
|
ALL INDIA LIVESTOCK CENSUS (in thousands)
|
|
Category
|
2007
|
2012
|
% Change
|
|
Total Cattle
|
1,99,075
|
1,90,904
|
-4.10
|
|
Total Buffalo
|
1,05,342
|
1,08,702
|
3.19
|
|
Total Yaks
|
83
|
77
|
-7.64
|
|
Total Mithuns
|
264
|
298
|
12.88
|
|
Total Bovines
|
3,04,764
|
2,99,981
|
-1.57
|
|
Total Sheep
|
71,558
|
65,069
|
-9.07
|
|
Total Goat
|
1,40,537
|
1,35,173
|
-3.82
|
|
Total Horses & Ponies
|
612
|
625
|
2.12
|
|
Total Mules
|
137
|
197
|
43.07
|
|
Total Donkeys
|
438
|
319
|
-27.17
|
|
Total Camels
|
517
|
400
|
-22.63
|
|
Total Pigs
|
11,133
|
10,294
|
-7.54
|
|
Total Livestock
|
5,29,696
|
5,12,057
|
-3.33
|
|
Total Dogs
|
19,088
|
11,673
|
-38.85
|
|
Total Rabbits
|
424
|
592
|
39.55
|
|
Total Elephants
|
1
|
22
|
|
|
Total Poultry
|
6,48,829
|
7,29,209
|
12.39
|
(Source: 19th Livestock Census-2012)
India’s livestock sector is one of the largest in the world. As per the 20th Livestock Census (2019), the total livestock population in the country is 535.78 million showing an increase of 4.6 per cent over Livestock Census 2012. It includes 302.79 million bovine population (cattle, buffalo, mithun and yak), an increase of 0.93 per cent over the previous census. The total number of cattle in the country is 192.49 million in 2019, showing an increase of 0.8 per cent over the previous census.
In Kerala, the livestock sector is prominent and is one of the fastest growing sectors in the rural economy. The share of livestock in Gross State Value Added (GSVA) at constant prices from agriculture sector shows an increase from 27.8 per cent in 2019-20 to 28.21 per cent in 2020-21. Its share in total GSVA of the State has also increased by 2.66 per cent in 2020-21.
As per the 20th Livestock Census, the livestock population in the State was 38.36 lakh. The reason for decline is the reduction in the population of other animals, especially domestic dogs, rabbits, donkeys, and elephants (which form the major share) by 14.69 per cent. The poultry population is 298.18 lakh, which accounts for 3.5 per cent of total poultry population in the country. The sector registered 25 per cent increase over the previous census. The growth rate of poultry population in Kerala is higher than the growth rate recorded at the national level (16.81 per cent).
Livestock Development: Livestock sector in Kerala is livelihood intensive and also a major contributor to Gross State Domestic Product (GSDP), it could be as high as 40 percent of the agricultural GSDP in Kerala. Contribution of livestock sector to the GSDP, is not made visible because it is always clubbed with Agriculture and allied sectors. Livestock production has been traditionally practiced in the State mainly as an extensive, low input subsistence system integrated with crop production. The subtle changes emerging in the sector calls for reorientation in the approach for future development and growth.
Major Livestock Products in Kerala
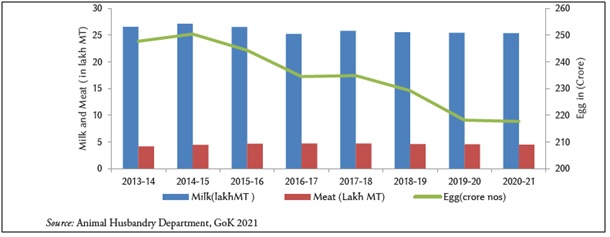
Milk, meat and egg are the major livestock products in the State. The production of these three livestock products during 2013-14 to 2020-21 is shown below:
Production of milk, egg and meat from 2013-14 to 2020-21
Milk production
India continues to be the largest milk producing country with 20.17 per cent share in total milk production in the world in 2019-20. At the national level, the milk production has increased from 18.78 crore tonnes in 2018-19 to 19.84 crore tonnes in 2019-20 registering a growth of 5.64 per cent, sustaining the trend over the past three decades. The highest five milk producing States are Uttar Pradesh (16.06 per cent), Rajasthan (12.89 per cent), Madhya Pradesh (8.62 per cent), Gujarat (7.71 per cent), and Andhra Pradesh (7.69 per cent), which together contributes 52.96 per cent of total milk production in the country. Kerala ranks 14th position among the major milk producing states in India. The per capita availability of milk has been increasing in India over the years and is 406 gram per day in 2019-20. The highest per capita availability is in Punjab (1,221 gram per day) followed by Haryana (1,115 gram per day). The species wise milk production shows that nearly 35 per cent of total milk production is contributed by indigenous buffaloes followed by 28 per cent by cross bred cattle. The indigenous cattle contribute 10 per cent of the total milk production. Goat milk shares a contribution of 2.95 per cent in the total milk production across the country.
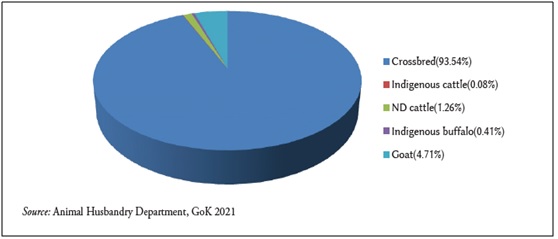
The total requirement of milk in Kerala in 2020-21 was 33.37 lakh MT, but the supply was only 25.34 lakh MT resulting in a deficiency of 8.03 lakh MT milk. This necessitated an import of 2.51 lakh MT. Out of 25.34 lakh MT of milk produced in the State, major share was produced by cross bred cows (93.54 per cent). Indigenous cows produced only 0.319 lakh MT of milk (1.26 per cent). The production of milk from goat was 1.19 lakh MT (4.71 per cent). The rest was contributed by non-descript cattle, indigenous buffalo and non-descript buffalo. Details of species wise milk production in Kerala in 2020-21 is provided below:
Species wise milk production in Kerala in 2020-21
Egg Production
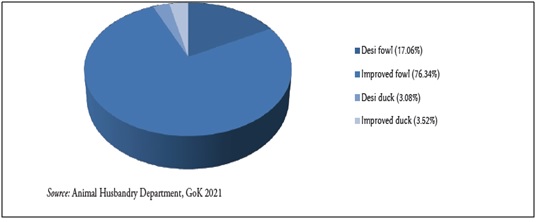
Kerala ranks 13th among States of India in egg production. The production of egg in Kerala has witnessed drastic changes during the 13th Five Year Plan period. The total egg production in the State was at 235 crore eggs in the year 2017-18, and it declined to 229 crore in 2018-19. In 2019-20, the total egg production was 218.12 crore eggs while in 2020-21, the total eggs produced in the State further declined to 217.68 crore. The per capita availability of eggs was 62 eggs and per capita consumption in 2020-21 was 128 eggs per annum. The total egg produced in the State was 217.68 crore eggs, but the requirement was 533.91 crore eggs. The deficiency of 316.23 crore eggs necessitated an import of 234.92 crore. About 76.34 per cent of the total eggs produced in the State are from improved fowl and around 17.06 per cent are from desi fowl. The contribution of desi duck and improved duck to the total egg production of the State is 3.08 per cent and 3.52 per cent respectively. Around 99.75 per cent of eggs produced in the State come from backyard poultry. Commercial poultry contributes very small share (0.25 per cent), warranting emphasis on backyard poultry in future. For backyard poultry, the average yield per year for desi fowls and desi ducks are 144 eggs and 161 eggs per year. With regard to improved fowls, and improved ducks the average yield is 221 eggs and 168 eggs per year. The details of species-wise poultry production in Kerala is shown below:
Species wise poultry production in Kerala 2020-21
Meat Production
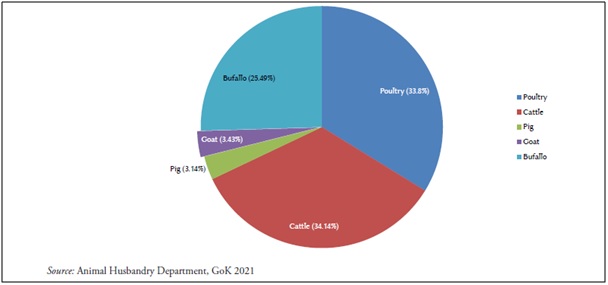
The total requirement of meat in Kerala was 4.94 lakh MT but the supply was only 4.48 lakh MT resulting in a deficiency of 0.46 lakh MT meat that necessitated an import of 0.14 lakh MT processed meat in 2020-21. Domestic demand for meat has been growing at a faster rate. In this context, it is essential to expand the “Kerala Chicken” scheme over the next five years.A scheme to encourage growing of male calves should also be thought of in this regard. Species wise meat production in Kerala is shown below:
Species wise meat production in Kerala 2020 - 21
Trend in Livestock Population: Cattle population in Kerala which was 33.96 lakh in 1996 declined to 21.22 lakh in 2003 and further to 17.20 lakh by 2007. The crossbred cattle population which stood at 22.87 lakhs (67%) as per 1996 Census decreased to 17.35 lakh numbers and in percentage terms increased to 82% by 2003. It further declined to 16.21 lakh numbers and in percentage terms increased to 93% in 2007. This increase in proportion of crossbred population was made possible by expanded health care facilities and artificial insemination services available in the state.
Based on the 19th Livestock Census-2012, the total number of livestock population in Kerala is 2735162 and the population of poultry is 24281928
|
Number of animals Per 1000 Households
|
|
State
|
Number of Households
|
Number of Cattles
|
Number of Buffaloes
|
Number of Sheep
|
Number of Goats
|
Number of Pigs
|
|
Kerala
|
8839154
|
150
|
12
|
0
|
141
|
6
|
Fisheries Sector:
The demand for fish and fishery products are increasing considerably in the country, both in domestic and exports fronts. The major share of 5.34 million tonnes is expected from inland aquaculture followed by 3.10 million tonnes from marine fisheries (Planning Commission 2007). The global production of fish from aquaculture has grown rapidly during the past four decades (accounts for nearly 45 percent of the world's food fish). China account for 67.3 percent of the food fish aquaculture production followed by India (5.9%) and Vietnam (3.0%).
India is endowed with vast fisheries resources in terms of a coast line of 8118 km and 2.02 million sq.km of exclusive economic zone, including 0.53 million sq.km of continental shelf. The inland fisheries include rivers and canals (1.95 lakh km), reservoirs (3.15 million ha), food plain wetlands (0.30 million ha), estuaries (0.26 million ha), fresh waters (2.41 million ha) and brackish water bodies (1.24 million ha). These resources are one of the main sources of livelihood for the rural poor, particularly the fisher community. At present, an estimated 14 million people are engaged in fishing, aquaculture and ancillary activities in the country.
The state has all the requisite natural endowments for building a strong and vibrant fisheries economy in tune with the national strategy. They include a stretch of coastal belt extending over 590 km and extensive inland water spread of around 4 lakh hectares. The exclusive economic zone (sea spread up to 200 metres) lying adjacent to Kerala coast is spread over 36000 square kilometres which is almost equivalent to the land area of the state.
The estimated fisher folk population of Kerala is 11.114 lakh, which include 8.558 lakh in the marine sector and 2.556 lakh in the inland sector. There are 222 fishing villages in the marine and 113 fishery villages in the inland sector, where fishing and relative activities provide livelihood to a vast majority of the population. Alappuzha district is the first place in the number of fisher folk with a population of 1.86 lakh followed by Thiruvananthapuram (1.83 lakh).
Marine fish landings of India in 2019-20 was 3.73 million tonnes. Among the states Gujarat was the highest contributor followed by Tamil Nadu and Andhra Pradesh. Kerala occupies fourth position with a production of 4.75 lakh tonnes. The high value species among the fish catches are still few and prominent among them are seer fish, prawns, ribbon fish and mackerel. Due to climate change and anthropogenic activities such as juvenile fishing, overfishing, unscientific fishing, the catch of marine fisheries shows a declining trend in the last decade. But the timely amendment of the Kerala Marine Fishing Regulation Act (KMFRA), introduction of KMFR rule and its strict enforcement led to an increase of 26 per cent in marine capture in 2018-19. The marine fish production in the State in 2020-21 however shows a decline. This may be because of poor climatic conditions and rough weather at sea. The loss of man-days due to Covid-19 pandemic also aggravated the situation. Species wise marine fish landings in Kerala from 2017-18 to 2020-21 is shown below:
Fish production in India and Kerala – Share of Marine and Inland fishing
.jpg)
Species -wise Composition of Fish Landing
India endowed with a long coast line of 8129 kms, 2.02 million sq.km of exclusive economic zone and 1.2 million hectares of brackish water bodies, offers vast potential for development of fisheries. The demand for fish and fishery products are increasing both in domestic and export fronts. About 3.9 million tonns fishery potential are estimated from marine sector only 2.6 million tonnes are tapped. 93% of the fish production contributed by artisanal, mechanised and motorised sector, remaining 7% is contributed by deep sea fishing. India has been a major contributor to the world marine fish production and second largest producer of inland fish. The south west comprising Kerala, Karnataka and Goa were the highest contributor among regions and Tamilnadu among states (21%) followed by Kerala (20%). The anticipated natural growth rate of the XI plan period is 8.5% against the current growth rate of 7%. Presently fisheries and aquaculture contribute 1.2% to the national GDP and 5.3% to agriculture and allied activities. In Kerala, fishing industry occupies an important position in its economy. Kerala’s share in the national marine fish production is about 20-25%. The water resources of this state comprise of a coastline of 590 Km length having a continental shelf area of the sea adjoining the Kerala state is 39139 sq.kms. Fisheries sector contribute 3% of the GSDP of the state.
According to the Kerala Marine Fisheries Regulation Act, the inshore Area coming within the depth range of 50 meters has been demarcated for fishing by the traditional fishermen using country crafts and the area beyond the limit in the economic zones can be utilized by motorized boats and large vessels. As this restriction is not being strictly followed, monsoon trawling has been banned from 1980 onwards as preventive measures. Although the fish catches from the Kerala coast include more than 300 different species, the commercially important number about forty only. The high value species among the fish catches are still few; prominent among them are seer fish, pomfret and prawn. Ribbon fishes are also now a target group. During 2006-07 the catch of Ribbon fish was 18000 tonnes. Unfortunately the share of these high value varieties in the total marine fish catch has been remaining stagnant. The annual potential of prawn is estimated by 64482 tonnes. The average catch of prawn during 2006-07 was 56779 tonnes. The catch of oil sardine, the most important variety consumes mainly by the poorer sections of the society exceeded the potential in recent years. The catch of sardine during 2006-07 was 2.15 lakh tonnes.
Kerala is a coastal state and is bordered on the west by the marine flora and fauna rich Arabian Sea. Marine fish landings of India in 2010 was 3.07 million tones which recorded a decline of about 1.31 lakh tones compared to the estimate for 2009. Among the states, Tamilnadu was the highest contributor of marine fish followed by Kerala. During 2010-11, 5.6 lakh tonnes of marine fish were landed in Kerala showing a decrease of 0.10 lakh tonnes (1.75%) over the previous year. The fish catches from the Kerala coast include more than 300 different species; the commercially important number is about 40 only. The high value species among the fish catches are still few, prominent among them are Seer fish, Prawn, Ribbon fish and Mackerel. During 2010-11 the catch of Ribbon fish was 15196 metric tones and penaeid prawn was 47620 metric tones. The quality of these high value species in the total catch ultimately decides the income of the fishermen. Oil sardine accounted for the major share of landings (27%), heavy landing of juvenile oil sardine in ring seine was also recorded. The catch of oil sardine was 151839 metric tonnes during 2010-11, shows a decreasing trend over the previous years, which is the most important variety consumed mainly by the poorer sections of the society.
► Species wise composition of Marine fish landings in Kerala (2004-2005 to 2006-2007)
► Species-wise Inland Fish Production in Kerala (2003-04 to 2006-07)
The total fish production in Kerala in 2017-18 was 6.73 lakh tonnes, of which Marine fish landings were 4.84 lakh tonnes and Inland fish production was 1.89 lakh tonnes. Details are provided below. Year-wise details of fish production in Kerala are provided in the figure below:
|
Fish Production in Kerala & India during the last Five years (lakh tones)
|
| |
Kerala
|
All India
|
|
Year
|
Marine
|
Inland
|
Total
|
Marine
|
Inland
|
Total
|
|
2013-14
|
5.22
|
1.86
|
7.08
|
34.43
|
61.36
|
95.79
|
|
2014-15
|
5.24
|
2.02
|
7.26
|
36.27
|
67.08
|
103.35
|
|
2015-16
|
5.17
|
2.10
|
7.27
|
36.3
|
71.65
|
107.95
|
|
2016-17
|
4.88
|
1.88
|
6.76
|
36.3 (P)
|
77.79 (P)
|
114.09(P)
|
|
2017-18
|
4.84
|
1.89
|
6.73
|
Not Available
|
|
Source: Department of Fisheries, GoK; Department of Animal Husbandry, Dairying & Fisheries, GoI
|
Fish production in Kerala , 2013-14 to 2017-18
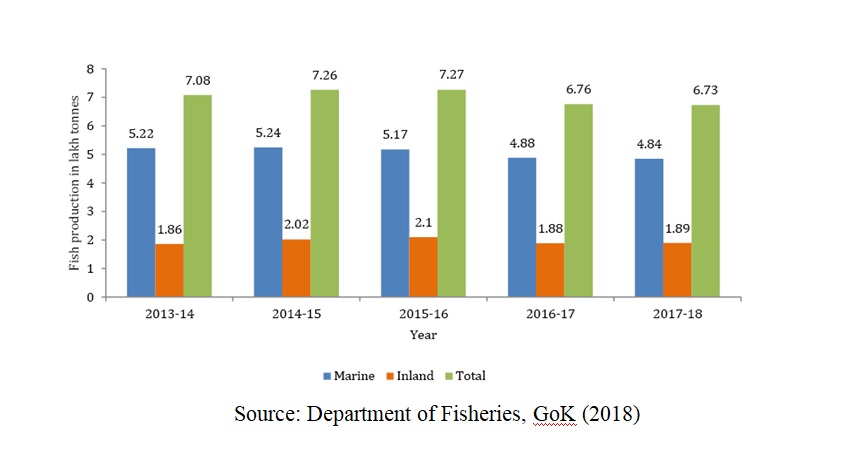
Total fish production in the State has been declining during the past two years. Marine fish production is decreasing since 2014-15. High-value species among the marine fish catch is less. However, significant among them are Seer fish, Prawn, Ribbon fish and Mackerel. The quality of these high-value species in the total catch is the crucial determinant of the income of the fish workers. The species-wise marine fish landings in Kerala from 2014-15 to 2017-18 are shown here.
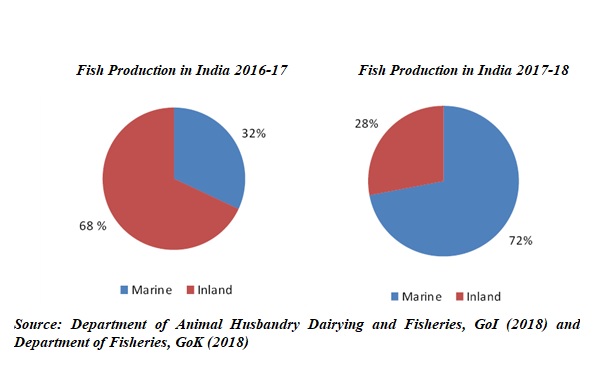
At national level about 68 per cent of the total fish production is contributed by the inland sector, however, at the State level, the share of the inland sector is only
Income from Fisheries sector: The Gross State Domestic Product of the State has increased by about 97% during the period from 2005-06 to 2010-11 and the share of fisheries sector in the State Domestic Product has declined from 1.81 to 1.29 percent in the same period. The share of Primary Sector in GSDP has also declined from 18.05 to 14.07 percent. The contribution of fisheries sector in GSDP is given here.
Trend in Production:
Marine fisheries throughout the world are passing through a critical phase due to the present rate of biodiversity loss and fishing practices. Indian marine fisheries is also passing through a crisis due to its over capacity and open access nature. Marine fish production in India has showed a declining trend over the previous year. Estimates of the fishery resources assessment shows that among the maritime states in India, Kerala occupies the 2nd position in marine fish production. The fish production in Kerala during 2010-11 was 6.81 lakh tonnes. The marine fishery resources of the state has almost attained the optimum level of production. During 2000-01 the inland fish production reached peak share of 13% of the total fish production of the state and thereafter declined slightly. At national level more than 50% of the total fish production is contributed by the inland sector. Government have approved a master plan for increasing the inland fish production of the state from the current level of 75000 tonnes to 2 lakh tonnes over a period of 10 years. It also aims at enhancing and developing the aquaculture for the economic and development of the state and ensuring food and livelihood security of the people in Kerala. The current level of Inland fish production is to the quantum of about 1.21 lakh tonnes.
The National Agriculture Policy, which aims to attain a growth rate in excess of four percent annum in the agriculture sector, stresses the importance of food and nutritional security issues and the importance of animal husbandry and fisheries sectors in generating wealth and employment. India is one of the major fish producing countries in the world with third position in fisheries and second in inland fish production. During 2010-11, India’s total fish production was 6.82 million tones of which 3.07 million tonnes was from marine sector and 3.75 million tonnes was from Inland sector. The fisheries sector has contributed 1.1% of the National GDP and 4.7% of the GDP from Agriculture sector. While marine fish production in Kerala tended to fluctuate the inland fish production showed a sign of improvement from 1999-2000. During 2010-11, the marine fish production has decreased to 5.6 lakh tonnes from 5.70 lakh tonnes of 2009-10. Inland production sustained on increasing trend. District wise marine fish production showed that Alappuzha contributed the highest (23.08 %) followed by Kollam (20.35%) and Kozhikode (14.95%). During 2010-11 the share of inland fish production to the total fish production of the state was 17.78%. The details of fish production for the last 5 years are given here.
The species-wise details of inland fish production in Kerala from 2014-15 to 2017-18 are given here.
Inland fish production had improved during the period 1999-2000 to 2015-16 and has been declining thereafter. A marginal increase was seen in 2017-18 when compared to 2016-17. According to the Annual Report of the Department of Animal Husbandry Dairying and Fisheries, Government of India (2017-18), inland water resources of Kerala constitute over 7 per cent of the same in the country. However, according to statistics from Indian Agricultural Statistics Research Institute (ICAR), the share of Kerala in total inland fish production (2014-15) is only about 2.4 per cent. States with smaller inland water resource endowment like Assam, Chhattisgarh and Uttar Pradesh have shown better inland fish production. Kerala has scope to improve the utilisation of its potential in Inland fishing.
The population of Kerala is 334 lakh according to Census 2011 and the fisherfolk population in 2017-18 is estimated to be around 3.1 per cent of Census population. They reside in 222 marine fishing villages and 113 inland fishing villages of the State. The fisherfolk population of the State for 2017-18 is estimated at 10.34 lakh. Out of this, 7.96 lakh belong to the marine sector while 2.38 lakh belong to the inland sector. Alappuzha (1.92 lakh) is the district with largest fisherfolk population, followed by Thiruvananthapuram (1.71 lakh) and Ernakulam (1.37 lakh).
An analysis of the figures of District-wise fish production in Kerala shows that Kollam is the leading producer of marine fish followed by Thiruvananthapuram and Ernakulam. These 3 Districts together contribute around 79 per cent of the total marine fish production in the State. Kasaragod, Kottayam and Alappuzha are the leading Districts in the case of inland fish production occupying the first, second and third positions respectively. In the case of total fish production, the leading producer is the District of Kollam followed by Ernakulam and Thiruvananthapuram respectively. Details are given here.
Marine fisheries throughout the world is passing through a critical phase due to the present rate of biodiversity loss, Covid-19 pandemic and exploitative fishing practices. Though the marine fish production in India showed a declining trend in 2019-20, the inland fish production in India registered a steady growth rate from 2016-17 to 2019-20. The difference in the composition of total fish production in India and Kerala is below: Marine fisheries throughout the world is passing through a critical phase due to the present rate of biodiversity loss, Covid-19 pandemic and exploitative fishing practices. Though the marine fish production in India showed a declining trend in 2019-20, the inland fish production in India registered a steady growth rate from 2016-17 to 2019-20. The difference in the composition of total fish production in India and Kerala is below:
Fish Production in Kerala& India during the last Five years (lakh tonnes)
|
Years
|
Kerala
|
All India
|
|
Marine
(Provisional)
|
Inland
|
Total
|
Marine
|
Inland
|
Total
|
|
2016-17
|
4.88
|
1.88
|
6.76
|
36.25
|
78.06
|
114.31
|
|
2017-18
|
4.84
|
1.89
|
6.73
|
36.88
|
89.02
|
125.90
|
|
2018-19
|
6.1
|
1.92
|
8.02
|
38.53
|
97.2
|
135.73
|
|
2019-20
|
4.75
|
2.05
|
6.8
|
37.27
|
10 4.37
|
141.64
|
|
2020-21
|
3.9
|
2.24
|
6.14
|
|
|
|
|
Source: Fisheries department, GoK; Handbook on Fisheries Statistics -2020, Department of Fisheries, GoI
|
District wise fish production in Kerala 2020-21
|
District
|
Marine Fish Production
|
Inland Fish Production
|
Total Fish Production
|
|
Thiruvananthapuram
|
0.57
|
0.02
|
0.59
|
|
Kollam
|
0.97
|
0.06
|
1.03
|
|
Alappuzha
|
0.12
|
0.53
|
0.65
|
|
Pathanamthitta
|
0
|
0.046
|
0.05
|
|
Kottayam
|
0
|
0.55
|
0.55
|
|
Ernakulam
|
0.98
|
0.28
|
1.26
|
|
Idukki
|
0
|
0.02
|
0.02
|
|
Thrissur
|
0.2
|
0.15
|
0.35
|
|
Palakkad
|
0
|
0.057
|
0.06
|
|
Malappuram
|
0.23
|
0.035
|
0.27
|
|
Kozhikkode
|
0.54
|
0.027
|
0.57
|
|
Wayanad
|
0
|
0.013
|
0.01
|
|
Kannur
|
0.095
|
0.015
|
0.11
|
|
Kasargode
|
0.19
|
0.44
|
0.63
|
|
State (Kerala)
|
3.90
|
2.24
|
6.14
|
|
Source: Directorate of Fisheries
|
Export:
The marine fisheries sector in the country contributes about 81% of the total fish production and is one of the major contributors to foreign exchange earnings through sea food export. It constitutes about 16% of the total agriculture products export. Over 55 varieties of marine products are exported to different countries in South East Asia, Europe, China, Japan and USA. The total value of marine products export from the country was 12901.47 crore in 2010-11 which accounts for approximately 1.1% of the total export from India. The quantity of marine exports from India during 2010-11 was 8.13 lakh tones. When compared to the previous year, it recorded a growth of 28.39% in rupee terms, 19.85% in volume and 33.95% growth in US$.
During 2010-11, the export earnings have crossed 2.8 billion US dollars and Rs.12,000 crore mark. Frozen shrimp is continued to be the single largest item of export in terms of value. It accounts 44.32% of the total export earnings. The other major items of export are Frozen Fin fish, frozen cuttle fish, etc. During 2002-03 and 2003-04 USA emerged as the single largest market for India’s marine products and during 2004-05, the European union has collectively became the largest importer of Indian marine products and retained its position since 2005-06.
During 2010-11, European union continued as the largest market with a share of 26.78% in value followed by South East Asia (16.43%), China (15.41%), USA (15.35%) and Japan (13.06%). The major ports of India to handle the export cargo during the year in the order of value were Pipavav (16.94%), Kochi (15.61%), JNP (15.54%) and Chennai (13.03%). Export from Kochi port showed an increase in quantity as well as in rupee realization where as there was a decline in US$ terms by 0.69%. The marine products export from the State during 2010-11 was 1.25 lakh tonnes, an increase of 16.14% over previous year. It valued at Rs.2002.10 crore constituting 15.33% in terms of volume and 15.52% in terms of value to Indian marine product export. The major export item is frozen shrimp during 2010-11. The state’s share in all India exports has been declining in recent years. The share declined from 20% in quantity terms in 2000-01 to 15.33% in 2010-11 and the share in value decreased to 15.52% from 16%. Export of marine products from Kerala and India during 2010-11 are given here.
Kerala has made vital contributions to the export of marine products from the country. In 2017-18, export of marine products from Kerala was 1, 78,646 tonnes valued at ₹5,919.03 crore. Quantity and value of exports of marine products from Kerala have been increasing since 2015-16. However, the share of Kerala in the total export of marine products from India is falling, in terms of quantity and value. Details are provided in given below:
|
Export of Marine Products from India and Kerala (Q: Quantity in Metric Tonnes V: Value - Rs. in crore)
|
|
Year
|
Measure
|
India
|
Kerala
|
% share of Kerala
|
|
2012-13
|
Q
|
928215
|
166399
|
17.93
|
|
V
|
18856.26
|
3435.85
|
18.22
|
|
2013-14
|
Q
|
983756
|
165698
|
16.84
|
|
V
|
30213.26
|
4706.36
|
15.58
|
|
2014-15
|
Q
|
1051243
|
166754
|
15.86
|
|
V
|
33441.61
|
5166.08
|
15.45
|
|
2015-16
|
Q
|
945892
|
149138
|
15.77
|
|
V
|
30420.82
|
4644.42
|
15.27
|
|
2016-17
|
Q
|
1134948
|
159141
|
14.02
|
|
V
|
37870.9
|
5008.54
|
13.23
|
|
2017-18
|
Q
|
1377244
|
178646
|
12.97
|
|
V
|
45106.89
|
5919.03
|
13.12
|
|
Source: MPEDA
|
(1)Directorate of Fisheries
(2) Livestock census report/animal husbandry department
(3) Directorate of Economics and Statistics
(4) Economic Review 2010-2021