Motor Vehicle & Road Safety Statistics
Road Trafiic
The number of motor vehicles having valid registrations as on March, 2023 is 163.52 lakh as against 155.65 lakh in the previous year, a growth of 5.06 per cent. The number of vehicles per 1,000 population for Kerala as on March, 2023 is 490. As of March, 2023, the total number of two wheelers (Motor Cycles/Scooters/Mopeds) registered in the State is 106.79 lakh and there are 7.28 lakh auto rickshaws and 34.62 lakh cars in the State. There are 79,621 contract carriages (including Omni bus) and 50,168 stage carriages are registered in the State as of March, 2023.The number of newly registered vehicles in 2022-23 is 7.87 lakh (7.18 lakh in 2021-22). The growth in the number of motor vehicles in the last ten years since 2013 is shown below:
Growth in number of Motor Vehicles, since 2013
.jpg)
Source: Motor Vehicles Department
The highest vehicle population was recorded in Ernakulam District with 23.22 lakh vehicles (14.2 per cent) followed by Thiruvananthapuram with 20.31 lakh (12.42 per cent). Wayanad District has the lowest number of 2.75 lakh vehicles (1.68 per cent). The mismatch between growth in motor vehicles and the capacity augmentation of roads has resulted in increasing traffic congestion and road accidents throughout Kerala. Distribution of motor vehicles registered in the State by type in 2022-23 is given below:
Distribution of Motor Vehicles Registered by type, 2022 to 23, in per cent
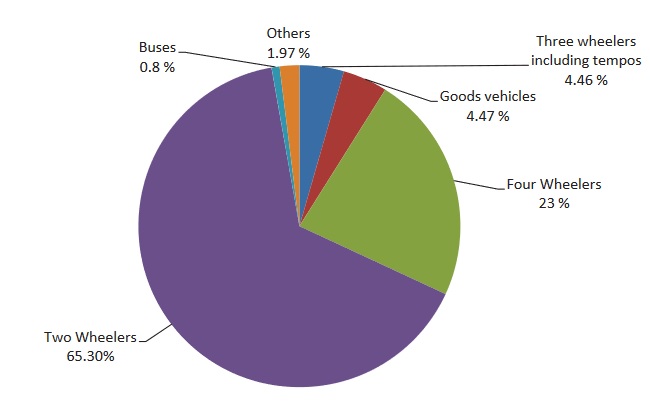
Source: Motor Vehicles Department
Road Safety
The major road network of Kerala, though well connected, faces severe constraints because of the urban sprawl and haphazard ribbon development all along the routes. The existing traffic levels at most stretches are excessive and beyond road capacity. Capacity augmentation of existing roads is beset with problems relating to limited right of way and land acquisition.The major road network of Kerala, though well connected, faces severe constraints because of the urban sprawl and the haphazard ribbon development all along the routes. The existing traffic levels at most stretches are excessive and beyond the road capacity. The traffic on roads is steadily increasing and creating pressure on road network. Capacity augmentation of existing roads is beset with problems relating to limited right of way and land acquisition.
According to State Crime Records Bureau (SCRB), 4,317 deaths and 49,307 injuries were reported in Kerala in 2022 from 43,910 road accidents. Thiruvananthapuram district reported the highest number of fatalities (543) in 2022 whereas Wayanad reported the least number (67) in 2022. As per the records of the SCRB, 2,776 deaths were reported in the State due to 32,073 motor vehicle accidents from January to August, 2023.
Majority of road accidents are by two wheelers that constitute 40.5 per cent of accidents occurred in the State in from January to August, 2023. The number of traffic accidents involving two wheelers was 17,789 (49 per day) in 2022 and it is 13,001 from January to August, 2023 (about 53 accidents per day). The percentage of vehicle category- wise accidents that occurred between January and August, 2023 in Kerala is shown below:
Details of road accident by vehicle type in Kerala, January to August, 2023, in per cent
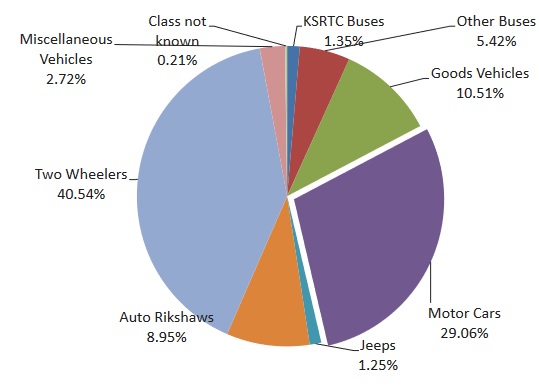
Source: State Crime Records Bureau
A total of 2,936 bus accidents were registered in the State in 2022. In the calendar year 2022, KSRTC buses involved in 551 accidents and other buses in 2,385 accidents. Trend of motor vehicle accidents, injuries and deaths reported in Kerala over a period from 2012 to August, 2023 is presented below:
Trend in Motor Vehicle Accidents in Kerala, 2010 to 2023*, in thousands
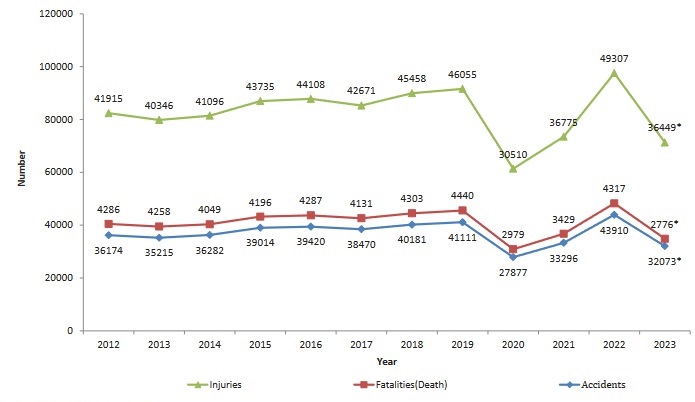
*Details as on August, 2023
Source: State Crime Records Bureau & Ministry of Road Transport & Highways
The trend of motor vehicle accidents in the State from 2012 to August,2023 reveals that the almost constant up to 2018, there was a surged in 2019 but declined substantially in 2020 and then increased from 2021 onwards. The rate of accident in the State was 196 per lakh vehicles registered in 2020, which increased to 224 in 2021 and 282 in 2022. The motor vehicles department has registered 15,66,629 cases of violation of motor vehicle rules including over speeding and red-light violation from June to September 2023 and an amount of Rs 14,98,30,750 was collected as penalty for the violation of motor vehicle and road rules in the period. Among districts, Thiruvananthapuram (2,47,558 cases) reported the highest number of incidents of traffic rule violations followed by Malappuram (1,72,076) and Thrissur (1,59,627). Wayanad (41,022) district reported the least number of violation incidents in the period from June to September, 2023.
Black spots in the State
Black Spots are the short stretches where the crashes/fatalities take place repeatedly, gets created on the road network due to various reasons. The NHAI has defined hazardous locations based on Accidents Severity Index (ASI) and Black spots as Hazardous spots with Accidents Severity Index (ASI) more than threshold value (Average Severity + 1.5 x Standard Deviation). The categorisation of black spots has been made on the basis of fatality and frequency of accidents in black spots namely black spots coming under class I category is more prone for accident and fatality and the same will be lower in class III black spots.
A total of 374 priority crash black spots are identified and prioritised based on the severity of the crashes occurring at crash black spots in the State. ‘Priority crash blackspots’ were further classified into Priority I black spots (250 locations) and Priority II black spots (124 locations). A total of 227 priority black spots were identified on National Highways in Kerala followed by 84 on State Highways and 63 on Other Roads.
National Transportation Planning and Research Centre (NATPAC) under the Kerala State Council for Science Technology and Environment (KSCSTE) had identified 4,592 accident black spots and hazardous locations across the State in the year 2021 based on the accident data for the years 2018-2020 collected from Kerala State Crime Records Bureau. As per the report submitted to the Kerala Road Safety Authority (KRSA), Ernakulam district has highest number (703) of accident black spots, followed by Thiruvananthapuram district (694) and Thrissur (548) districts. Identification, analysis and treatment of black spots are widely regarded as one of the most effective approaches in preventing road crashes. NATPAC at the instance of Kerala Road Safety Authority (KSRA) had also identified a total of 323 vulnerable road corridors on National Highways and State Highways in Kerala, of which, 149 corridors were on the National Highways and 174 corridors on the State Highways in Kerala.
Motor Vehicle & Road Safety Statistics 2006-2022
Source:
* Economic Review 2010-2023
* Motor Vehicle Department
* Department of Economics and Statistics, Kerala