Livestock
The livestock sector contributes in numerous ways to the socioeconomic development of rural households. As the distribution of livestock is more equitable than that of land, livestock production has a positive effect on farm income and, as a result, helps poverty alleviation in rural areas. It is one of the major sources of income for most farmers, provides key inputs to agriculture, contributes to the health and nutrition of the households, and enhances welfare options for the rural economy. The livestock sector is among the most promising in the agriculture and allied sectors. The Government provides substantial allocations to improve the sector’s performance in terms of productivity enhancement, disease control, fodder production, value addition, and adoption of scientific breeding practices.
India’s livestock sector is one of the largest in the world. As per the latest Livestock Census (2019), the total livestock population in the country is 536.76 million. The Livestock Census (2019) reports the State’s livestock population as 29.09 lakh. The poultry population in the State was 297.71 lakh, which accounts for 3.49 per cent of total poultry population in the country. The poultry population registered 22.61 per cent increase over that recorded in previous livestock census (2012). The growth rate of poultry population in Kerala (22.61 per cent) is higher than the growth rate recorded at the National-level (16.81 per cent).
All India Livestock Census:
The 20th Livestock Census was conducted in the country between 1st October 2018 to 20th September 2019. The livestock species such as Cattle, Buffalo, Sheep, Goat, Pig, Horses & Ponies, Mules, Donkeys, Camels, Mithun and Yak are covered in the census. The other species covered in the census are Dogs, Rabbits and Elephants. The 20th Livestock Census was carried out in about 6.6 lakhs villages and 89 thousand urban wards across the country covering more than 27 Crores of Households and Non- Households. In 20th Livestock Census, 35.94%-Cattle, 27.80%-Goat, 20.45%-Buffaloes,13.87%-Sheep, 1.69%-Pigs. Mithun, Yaks, Horses, Ponies, Mules, Donkeys and Camels taken together contribute 0.23% of the total livestock. As compare to previous census the percentage share of sheep and goat population has increased whereas the percentage share of cattle, buffalo and pig has marginally declined.
Key results of 20th Livestock Census are listed below:
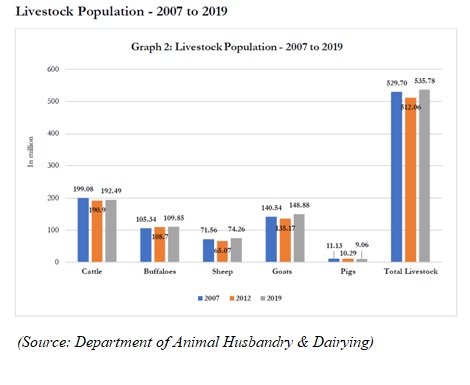
1. The total Livestock population is 535.78 million in the country showing an increase of 4.6% over Livestock Census- 2012
2. Total Bovine population (Cattle, Buffalo, Mithun and Yak) is 302.79 Million in 2019 which shows an increase of 1.0% over the previous census.
3. The total number of cattle in the country is 192.49 million in 2019 showing an increase of 0.8 % over previous Census
4. The Female Cattle (Cows population) is 145.12 million, increased by 18.0% over the previous census (2012).
5. The Exotic/Crossbred and Indigenous/Non-descript Cattle population in the country is 50.42 million and 142.11 million respectively.
6. The Indigenous/Non-descript female cattle population has increased by 10% in 2019 as compared to previous census
7. The population of the total Exotic/Crossbred Cattle has increased by 26.9 % in 2019 as compared to previous census.
8. There is a decline of 6 % in the total Indigenous (both descript and non-descript) Cattle population over the previous census. However, the pace of decline of Indigenous Cattle population during 2012-2019 is much lesser as compared to 2007-12 which was about 9%.
9. The total buffaloes in the country is 109.85 Million showing an increase of about 1.0% over previous Census.
10. The total milch animals (in-milk and dry) in cows and buffaloes is 125.34 Million, an increase of 6.0 % over the previous census.
11. The total sheep in the country is 74.26 Million in 2019, increased by 14.1% over previous Census.
12. The Goat population in the country in 2019 is 148.88 Million showing an increase of 10.1% over the previous census.
13. The total Pigs in the country is 9.06 Million in the current Census, declined by 12.03% over the previous Census.
14. The total Mithun in the country is 3.9 Lakhs in 2019, increased by 30.0% over previous Census. 15. The total Yak in the country is Fifty Eight Thousand in 2019, decreased by 24.67% over previous Census.
16. The total Horses and Ponies in the country is 3.4 Lakhs in 2019, decreased by 45.6% over previous Census.
17. The total population of Mules in the country is Eighty Four Thousand in 2019, decreased by 57.1% over previous Census.
18. The total population of Donkeys in the country is 1.2 Lakhs in 2019, decreased by 61.23% over previous Census.
19. The total Camel population in the country is 2.5 Lakhs in 2019, decreased by 37.1% over previous Census.
20. The total Poultry in the country is 851.81 Million in 2019, increased by 16.8% over previous Census.
21. The total Backyard Poultry in the country is 317.07 Million in 2019, increased by 45.8% over previous Census.
22. The total Commercial Poultry in the country is 534.74 Million in 2019, increased by 4.5% over previous Census.
Livestock Population - Major Species
|
Category
|
Population
(In million) 2012
|
Population
(In million) 2019
|
% growth
|
|
Cattle
|
190.90
|
192.49
|
0.83
|
|
Buffalo
|
108.70
|
109.85
|
1.06
|
|
Sheep
|
65.07
|
74.26
|
14.13
|
|
Goat
|
135.17
|
148.88
|
10.14
|
|
Pig
|
10.29
|
9.06
|
-12.03
|
|
Mithun
|
0.30
|
0.38
|
26.66
|
|
Yak
|
0.08
|
0.06
|
-25.00
|
|
Horses & Ponics
|
0.63
|
0.34
|
-45.58
|
|
Mule
|
0.20
|
0.08
|
-57.09
|
|
Donkey
|
0.32
|
0.12
|
-61.23
|
|
Camel
|
0.40
|
0.25
|
-37.05
|
|
Total Livestock
|
512.06
|
535.78
|
4.63
|
|
(Source: Department of Animal Husbandry & Dairying)
|
|
Species
|
Population
(In million) 2007
|
Population
(In million) 2012
|
Population
(In million) 2019
|
|
Cattle
|
199.08
|
190.9
|
192.49
|
|
Buffaloes
|
105.34
|
108.7
|
109.85
|
|
Sheep
|
71.56
|
65.07
|
74.26
|
|
Goats
|
14.054
|
135.17
|
148.88
|
|
Pigs
|
11.13
|
10.29
|
9.06
|
|
Mithun
|
0.26
|
0.30
|
0.38
|
|
Yaks
|
0.08
|
0.08
|
0.06
|
|
Horses & ponies
|
0.61
|
0.63
|
0.34
|
|
Mules
|
0.14
|
0.2
|
0.08
|
|
Donkeys
|
0.44
|
0.32
|
0.12
|
|
Camels
|
0.52
|
0.4
|
0.25
|
|
Total Livestock
|
529.70
|
512.06
|
535.78
|
|
(Source: Department of Animal Husbandry & Dairying)
|
Highlights of Kerala
- The total livestock population is 2908.66 thousands in the state showing an increase of 6.34% over Livestock Census- 2012.
- The Rural Livestock population 2652.75 thousands (91.2% of Total).
- The Urban Livestock population 255.91 thousands (8.8% of Total).
- Total Bovine population (Cattle and Buffalo) is 1443.50 thousands in 2019 which shows an increase of 0.88% over the previous census.
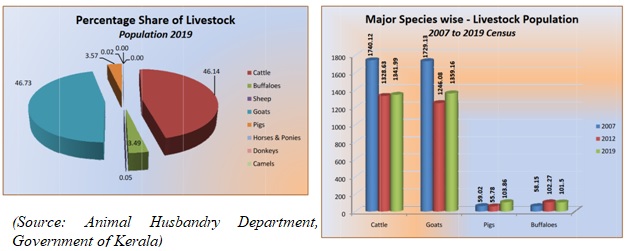
- Share of major species in 20th Livestock Census- Goat-46.73%, Cattle-46.14 %, Pigs-3.57%, Buffaloes-3.49%, Others-0.07%.
- The total number of cattle in the State is 1341.996 thousands in 2019 showing an increase of 1.01 % over previous Census(2012).
- The Female Cattle (Cow) population is 1218.79 thousands in 2019, increased by 3.29% over the previous census (2012).
- Highest Exotic/Crossbred cattle population is found in Palakkad followed by Kollam and Thrissur. Lowest Exotic/Crossbred cattle population is found in Kasaragod followed by Pathanamthitta and Alappuzha.
- Highest male Exotic/Crossbred cattle population is found in Palakkad followed by Malappuram and Kannur.
- Lowest male Exotic/Crossbred cattle population is found in Pathanamthitta followed by Kasaragod and Alappuzha.
- Highest Indigenous cattle is found in Thrissur followed by Eranakulam and Palakkad.
- Lowest Indigenous cattle is found in Kasaragod followed by Wayanad and Pathanamthitta.
- Highest Male Indigenous cattle is found in Thrissur followed by Palakkad and Malappuram.
- Lowest Male Indigenous cattle is found in Kasaragod followed by Wayanad and Pathanamthitta.
- Highest Non Descript cattle is found in Kasaragod followed by Palakkad and Kozhikode.
- Lowest Non Descript cattle is found in Thiruvananthapuram followed by Alappuzha and Malappuram.
- Highest Male Non Descript cattle is found in Kasaragod followed by Palakkad and Malappuram.
- Lowest Male Non Descript cattle is found in followed by Thiruvananthapuram followed by Alappuzha and Pathanamthitta.
- The total buffaloes in the State is 101.50 thousands showing a decrease of 0.75% over previous census.
- The Goat population in the State in 2019 is 1359.161 thousands showing an increase of 9.08% over the previous census.
- The total Pig in the State is 103.86 thousands in the current Census, showing significant increase from the previous Census.
- The total Poultry in the State is 29771.905 (pl check) thousands in 2019 increased by 22.61% over previous Census.
- The total sheep in the state is 1.482 thousands in 2019, increased by 2.49 % over previous census.
Distribution of Livestock Population - Major species from 2007 to 2019 Census
|
Species
|
Population
(In Thousands) 2007
|
Population
(In Thousands) 2012
|
Population
(In Thousands) 2019
|
|
Cattle
|
1740.12
|
1328.63
|
1341.99
|
|
Buffaloes
|
58.15
|
102.27
|
101.5
|
|
Sheep
|
0.97
|
1.45
|
1.48
|
|
Goats
|
1729.13
|
1246.08
|
1359.16
|
|
Pigs
|
59.02
|
55.78
|
103.86
|
|
Mithun
|
0.00
|
0.00
|
0.00
|
|
Yaks
|
0.00
|
0.00
|
0.00
|
|
Horses & ponies
|
0.05
|
0.22
|
0.56
|
|
Mules
|
0.00
|
0.23
|
0.00
|
|
Donkeys
|
0.03
|
1.5
|
0.07
|
|
Camels
|
0.00
|
0.01
|
0.03
|
|
Total Livestock
|
3587.47
|
2735.17
|
2908.65
|
Livestock Development: Livestock sector in Kerala is livelihood intensive and also a major contributor to Gross State Domestic Product (GSDP), it could be as high as 40 percent of the agricultural GSDP in Kerala. Contribution of livestock sector to the GSDP, is not made visible because it is always clubbed with Agriculture and allied sectors. Livestock production has been traditionally practiced in the State mainly as an extensive, low input subsistence system integrated with crop production. The subtle changes emerging in the sector calls for reorientation in the approach for future development and growth.
Major Livestock Products in Kerala
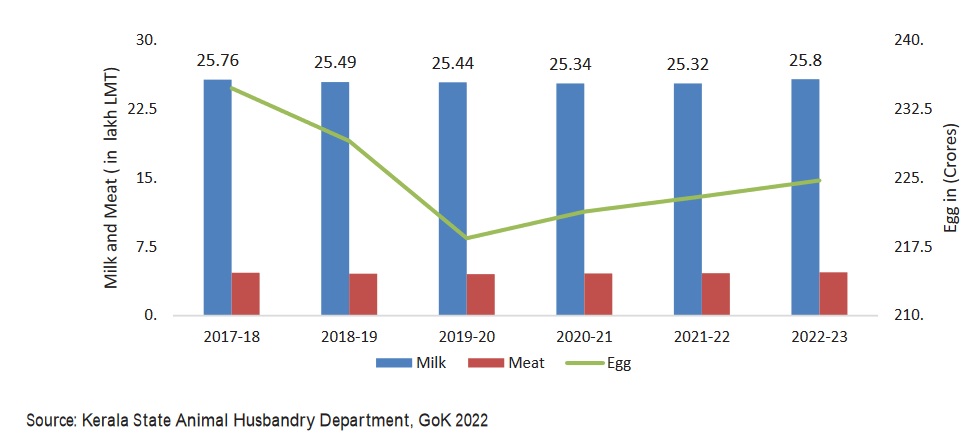
Milk, meat and egg are the major livestock products in the State. The production of these three livestock products during 2017-18 to 2022-23 is shown below:
Production of milk, egg and meat from 2017-18 to 2022-23
Milk production
India ranked 1st in milk production, contributing 24 per cent of global milk production. At the national-level, milk production has increased from 22.21 crore tonnes in 2021-22 to 23.06 crore tonnes in 2022-23, registering a growth of 3.83 per cent, sustaining the trend over the past three decades. The highest five milkproducing states in India in 2022-23 were Uttar Pradesh (15.72 percent) Rajasthan (14.44 Percent) Madhya Pradesh (8.73 per cent), Gujarat (7.49 per cent), and Andhra Pradesh (6.70 per cent), which together contributed 53.08 per cent of total milk production in the country. (The average yield per animal per day for exotic crossbred is 8.55 Kg per day and for indigenous/non-descript is 3.44 Kg per day (Basic Animal Husbandry Statistics, 2023).
The per capita availability of milk has been increasing in India over the years and is estimated at 459 grams/day in 2022-23 (Basic AH Statistics 2023 by DAHD, GOI). The highest per capita availability is in Punjab (1283 grams per day) followed by Rajasthan (1138 grams per day). The species-wise milk production in the country shows that nearly 31.94 per cent of total milk production is contributed by indigenous buffaloes, followed by cross-bred cattle 29.81 per cent. The indigenous cattle contribute 10.73 per cent of the total milk production in the country. Goat milk contributes 3.30 per cent of the total milk production (Basic Animal Husbandry Statistics, 2023).
Kerala ranks 15th among the milk-producing states. Kerala’s per capita availability is 198 grams per day (Basic Animal Husbandry Statistics, 2023). The total milk requirement in Kerala in 2022- 23 was 33.51 lakh metric tonnes. But the annual production was only 25.32 lakh metric tonnes, which resulted in an average outside purchase of 1.34 lakh litres of milk per day. Out of 25.32 lakh MT of milk produced in the State, a major share was produced by cross bred cattle (93.56 per cent). Indigenous cattle produced only 0.04 MT of milk (0.16 per cent). The contribution of nondescript cattle was 0.24 MT (0.95 per cent). The milk production from goats was 1.23 MT (4.86 per cent). Indigenous and non-descript buffaloes contributed the rest Details of species-wise milk production in Kerala in 2022-23 are given below:
Species wise milk production in Kerala in 2022-23
.jpg)
Even though the herd sizes are low compared to major milk-producing states, cattle productivity in Kerala is higher than the national average. The average milk yield per In-Milk animal of Exotic/ Crossbred cows in India in 2022-23 is 8.55 Kg/ day/animal. For indigenous cattle and non-descript cattle, it is) 3.44 kg/day/animal. The yield rate from Exotic/crossbred in Kerala is 10.77 kg per day, and 3.21 kg/day/animal from Indigenous/ Non-Descript. The third highest among the Indian states after Punjab (13.49 kg/day/animal) and Chandigarh 12.22 kg/day/animal (Basic Animal Husbandry Statistics 2023). This advantage for Kerala was due to high per cent of exotic and crossbred animals in the population compared to other states.
Egg Production
Egg and meat production in India has taken a quantum leap in the last four decades, emerging from an unscientific farming practice to a commercial production system with state of the art technological interventions. According to Food and Agriculture Organization Statistics (FAOSTAT) production data for 2023, India ranks third globally in egg production. Total egg production in India has increased from 129600 crore in 2021-22 to 138376 crore in 2022-23 registering a growth of 6.77 per cent. There has been a steady increase in the per capita availability of eggs since 2000-01. In 2022-23 the largest producer of eggs was Andhra Pradesh, which produces 20.13 per cent of total egg production in the country, followed by Tamil Nadu (15.58 per cent) and Telangana (12.77 per cent). Other states contributing a major share of the country’s egg production include West Bengal (9.93 per cent) and Karnataka (6.51 per cent). Kerala contributes 1.62 per cent to the total egg production in the country. The highest per capita availability of egg is in Andhra Pradesh (526 eggs per annum) followed by Telangana (466 eggs per annum) and Tamil Nadu (281 eggs per annum).
Kerala ranks 14th among the States of India, in egg production. The production of egg increased from 22.30 crore in 2021-22 to 22.475 crore in 2022-23 (Basic Animal Husbandry Statistics, 2023). The per capita availability of eggs in our State was 63 eggs per annum in 2022-23 which is lower than the country average of 101eggs per annum (Basic Animal Husbandry Statistics 2023).
According to Basic Animal Husbandry Statistics, 2023, about 59 per cent of the total eggs produced in the State are from Improved ducks and around 34 per cent are from improved fowls, 5 per cent from Desi ducks and 2 per cent from Desi fowls. The details of species wise egg production in Kerala is shown in Figure 3.3.3.
Species wise egg production in Kerala 2022-23
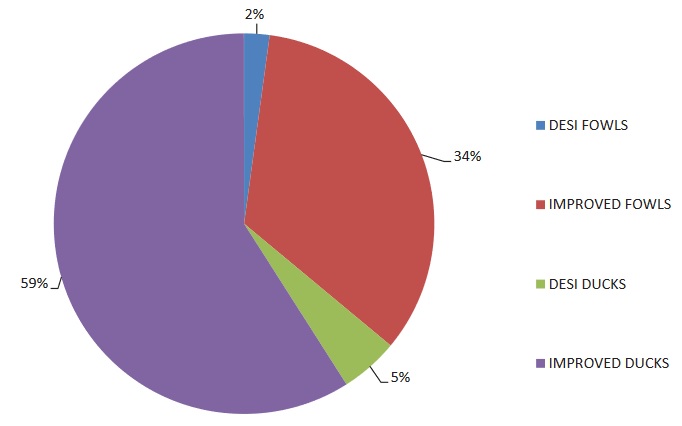
Source: Animal Husbandry Department, Gok 2023
Meat Production:
Meat production has witnessed a steady increase over the last ten years in our country. India ranks 8th in meat production in the world. Meat production in the country has increased by 5.13 per cent from 9.29 million tonnes in 2021-22 to 9.77 million tonnes in 2022-23. The largest producer of meat in the country in the year 2022-23 was Uttar Pradesh producing 12.20 per cent of the total meat followed by West Bengal (11.93 per cent), Maharashtra (11.50 per cent), Andhra Pradesh (11.20 per cent) and Telangana (11.06 per cent). These states together contribute 57.90 per cent of total meat production in the country in this period. Kerala’s contribution to the total meat production in the country is 4.84 per cent in 2022-23 (Basic Animal Husbandry Statistics 2023). Species-wise meat contribution shows that 51.14 per cent of meat production in the country is contributed by poultry in the year 2022-23. Uttar Pradesh, West Bengal and Maharashtra are the country’s largest meat producers in 2022-23 with 12.20, 11.93 & 11.50 percentage respectively. Kerala contributes 3.19 per cent in total meat production. In India’s total meat production, meat from cattle and buffalo accounts for 2.55 per cent and 18.51 per cent, respectively. Meat production from goat,sheep, pig and poultry is 15.21, 11.05, 4.05 percent and 53.76 percent respectively. In Kerala, majority of the meat is produced from cattle with 42.92 per cent in 2022-23 (Basic Animal Husbandry Statistics, 2023).
In the 13th Five-Year Plan, meat production in Kerala was 23.01 lakh MT. The floods of 2018 and 2019 and the impact of COVID-19 pandemic adversely affected the sector. Total meat production in 2022-23 was 4.74 lakh MT. The total requirement of meat in the State in 2022-23 was 8.75 lakh MT. Domestic demand for meat has been growing at a faster rate. In this context, expanding the “Kerala Chicken” scheme is essential over the next five years. A scheme to encourage growing of male calves should also be thought of in this regard. Species-wise meat production in Kerala is shown below:
Species wise meat production in Kerala 2022-23
.jpg)
Source: Animal Husbandry Department GoK 2023
Trend in Livestock Population:
The growth rate of cattle population in India was persistently positive up to the year 1992 might be due to the extensive cross-breeding and various development schemes and extension programs implemented by the Department of Animal Husbandry. However, the population shifted to a decreasing trend for the period 1992-97.The reasons for the decrease in cattle population in India might be due to rapid urbanization, decrease in grazing land, decrease in the supply of agricultural labour, the non-remunerative price for milk, decrease in the indigenous population, etc. The buffalo population in the country was found to be in constant positive growth rate. The sheep population in India has improved gradually at a positive rate for the first three periods (1951-56, 1956-61 and 1961-66), followed by a decline in the period 1966-72, again had a dip during the period 1982-87 and finally showed a positive trend till now. The gradual increase in growth of the sheep population might be associated with the steady increase in demand for mutton by the consumers and the lowest disease incidence among small ruminants compared to other livestock species.
It was peculiar to note that the goat population continued to increase from the initial period. The reasons for the positive trend in goat population in India might be connected with an increase in demand for chevon by the consumers, easy management practices for goats over other livestock species, the high remunerative price for chevon over other products, etc. The pig population in India had a positive trend overall the duration except during the periods 1961-66 and 2004-07 but during the last inter-census period, the growth rate in the pig population was found to be negative. The reasons might be due to reluctance by the entrepreneurs to start a pig farm because of socio-cultural inhibition and inadequate financial availabilities.
Fisheries Sector:
Fisheries is a prime and growing sector that plays a significant role in a developing economy by providing livelihood to millions of fish workers. Besides augmenting nutrition, it helps in generating employment and revenue. It is an intensive sector that is becoming more and more attractive to investors because of its low capital investment requirements, short gestation period and generation of high profit. Currently India is the third largest fish producing country in the world and accounts for 7.96 per cent of the global production. The sector has been one of the major contributors of foreign exchange earnings, with India being one of the leading seafood exporting nations in the world. In 2022-23, the export improved in quantity terms by 26.73 per cent. India is also a major producer of fish through aquaculture and ranks second in the world after China. Fishing industry of Kerala which comprises of fish catching, processing and marketing has the potential to generate employment to the tune of 566 lakh man days per year.
The fisheries sector plays an important role in the economy of the State. The share of fisheries sector in the total Gross State Value Added (GSVA at constant price) in 2022-23 constitutes 0.98 per cent and accounts for 0.84 per cent of Gross State Domestic Product (GSDP). Fisheries and aquaculture contributes 11.47 per cent of the GSVA (constant prices 2022-23 (Q)) from the agriculture and allied sectors. Details regarding the contribution of fisheries sector in GSVA are given below:
|
Contribution of Fisheries sector to Gross State Value Added (Base Year 2011-12)
(Rs. in crore)
|
|
Constant Price
|
|
Category
|
2018-19
|
2019-20
|
2020-21
|
2021-22 (provisional)
|
2022-23 (Quick)
|
|
Gross State Value added (at basic prices)
|
480226
|
493974
|
444989
|
501656
|
532686
|
|
Fishing and Aquaculture
|
4798.97
|
3998.89
|
3711.04
|
4838.34
|
5208.98
|
|
Share of fisheries sector in GSVA
|
0.99
|
0.81
|
0.83
|
0.96
|
0.98
|
|
Agriculture and allied activities
|
43342.7
|
42233.74
|
40804.75
|
45007.59
|
45400.51
|
|
Percentage Share of fisheries in Agriculture and allied activities
|
11.07
|
9.47
|
9.09
|
10.75
|
11.47
|
|
Source: Directorate of Economics & Statistics
|
Trend in Production:
Kerala has a coastline of 590 kilometres and a continental shelf of 39,139 sq. kms and is located at the most productive area of Arabian sea. It is one of the active maritime States in India. As per the Annual Report 2022-23, Department of Fisheries, Ministry of Fisheries, Animal Husbandry and Dairying, Government of India the fish production in India in 2021- 22 is estimated at 162.5 lakh MT with a contribution of 121.21 lakh MT from inland sector and 41.27 lakh MT from marine sector. In 2022-23, Kerala recorded an inland fish production of 2.29 lakh MT and the contribution from the marine sector was 6.9 lakh MT. The high value species among the fish catches are still few and prominent among them are seer fish, prawns, ribbon fish and mackerel. Due to climate change and anthropogenic activities such as juvenile fishing, overfishing and unscientific fishing, the catch of marine fisheries showed a declining trend in the last decade. But the timely amendment of the Kerala Marine Fishing Regulation Act (KMFRA), introduction of KMFR Rule and its strict enforcement led to an increase of 26 per cent in marine capture in 2018-19. The year 2022-23, has registered an increase in marine fish production compared to that of the production obtained in 2020-21 and 2021-22, which demonstrates the revival in the sector and increase in man-days. The inland fish production also increased in 2022-23 due to the introduction of diversified and innovative fish farming practices, across the State.
The production of most of the marine fishes like elasmobranchi, oil sardine, lesser sardine, anchoviella, saurida, perches, sciaenid’s ribbon fish, other carangids, mackerel soles, seer fish, tuna, leiognathids, penaeid prawn, crabs, and cephalopods have shown an increase in 2022-23. As per the Handbook of Fisheries Statistics, 2022, the per capita fish consumption of Kerala is 17.93 kg per year. Among the Union Territories, the Andaman and Nicobar Islands’ per capita fish consumption is 77.84 kg per year. The species-wise marine fish landings in Kerala from 2019-20 to 2022-23 are given below:
Fish Production in India and Kerala - Share of Marine and Inland fishing
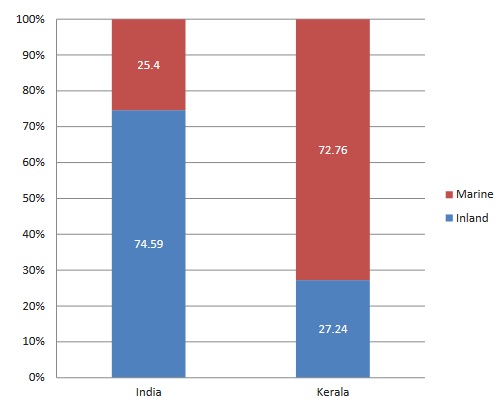
Source: Annual report 2022-23, Department of fisheries, Ministry of Fisheries, Animal Husbandry and Dairying, Government of India and Department of Fisheries, Government of Kerala
|
Species-wise composition of Marine fish landings in Kerala(2019-20 to 2022-23)
(in Metric Tonnes)
|
|
Sl. No
|
Species
|
2019-20
|
2020-21
|
2021-22
|
2022-23
|
|
1
|
Elasmobranchs
|
2764
|
1753
|
3596
|
4212
|
|
2
|
Eels
|
879 |
860
|
1099
|
964
|
|
3
|
Cat Fish
|
258 |
34
|
126
|
324
|
|
4
|
Chirocenrtrus
|
108 |
73
|
82
|
262
|
|
5(a)
|
Oil Sardine
|
44499 |
6762
|
12340
|
136946
|
|
(b)
|
Lesser Sardine
|
33199 |
42525
|
62042
|
15913
|
|
(c)
|
Hilsa ilisha
|
0 |
0
|
0
|
0
|
|
(d)
|
Other Hilsa
|
311 |
523
|
93
|
601
|
|
(e)
|
Anchovilla
|
58490 |
27247
|
38683
|
44786
|
|
(f)
|
Trissocles
|
7377
|
7510
|
5654
|
2862
|
|
(g)
|
Other Clupeids
|
5804
|
6479
|
7049
|
2797
|
|
6(a)
|
Harpodon nehereus
|
0
|
0
|
0
|
0
|
|
(b)
|
Saurida&Saurus
|
17445
|
14724
|
20308
|
12013
|
|
7
|
Hemirhamphus&Belone
|
739
|
722
|
753
|
789
|
|
8
|
Flying Fish
|
8
|
40
|
67
|
21
|
|
9
|
Perches
|
40955
|
47996
|
71572
|
69731
|
|
10
|
Red Mullets
|
443
|
410
|
1006
|
606
|
|
11
|
Polynemides
|
9
|
0
|
2
|
2
|
|
12
|
Sciaenides
|
5406
|
5830
|
8396
|
4207
|
|
13
|
Ribbon fish
|
5425
|
1524
|
9949
|
27613
|
|
14(a)
|
Caranx
|
2323
|
1695
|
1454
|
1287
|
|
(b)
|
Chorinemus
|
268
|
277
|
519
|
668
|
|
(c)
|
Thachynotus
|
11
|
87
|
6
|
7
|
|
(d)
|
Other Carangids
|
37775
|
53118
|
83392
|
57619
|
|
(e)
|
Coryphaena
|
1046
|
1074
|
1856
|
2697
|
|
(f)
|
Elacate
|
287
|
33
|
173
|
508
|
|
15(a)
|
Leiognathus
|
2942
|
2058
|
2344
|
2324
|
|
(b)
|
Gazza
|
0
|
1
|
19
|
0
|
|
16
|
Lactrious
|
839
|
903
|
1081
|
1219
|
|
17
|
Pomfrets
|
2147
|
6482
|
2758
|
2387
|
|
18
|
Mackerel
|
35894
|
60592
|
63587
|
102084
|
|
19
|
Seer fish
|
4329
|
3806
|
6176
|
7181
|
|
20
|
Tunnas
|
16793
|
13197
|
23067
|
37496
|
|
21
|
Sphyraena
|
3480
|
5040
|
7120
|
8374
|
|
22
|
Mugil
|
55
|
16
|
31
|
59
|
|
23
|
Bregmaceros
|
0
|
0
|
0
|
0
|
|
24
|
Soles
|
14197
|
6245
|
12100
|
10410
|
|
25(a)
|
Penaeid Prawn
|
39905
|
33524
|
54868
|
31590
|
|
(b)
|
Non Penaeid Prawn
|
2515
|
2187
|
2825
|
6639
|
|
(c)
|
Lobsters
|
41
|
48
|
101
|
109
|
|
(d)
|
Crabs
|
5080
|
4087
|
6145
|
6434
|
|
(e)
|
Stomatopods
|
488
|
12
|
158
|
47
|
|
26
|
Cephalopods
|
35686
|
19786
|
42716
|
46275
|
|
27
|
Miscellaneous
|
45148
|
12403
|
45489
|
40882
|
|
Total
|
475368
|
391683
|
600802
|
690945
|
|
Source: Directorate of Fisheries
|
The difference in the composition of total fish production in India and Kerala is given below:
|
Fish Production in Kerala& India (2017-18 to 2022-23) (lakh tonnes)
|
|
Year
|
Kerala
|
All India
|
|
Marine
|
Inland
|
Total
|
Marine
|
Inland
|
Total
|
|
(Provisional)
|
|
2017-18
|
4.84
|
1.89
|
6.73
|
36.88
|
89.02
|
125.9
|
|
2018-19
|
6.1
|
1.92
|
8.02
|
38.53
|
97.2
|
135.73
|
|
2019-20
|
4.75
|
2.05
|
6.8
|
37.27
|
104.37
|
141.64
|
|
2020-21
|
3.9
|
2.05
|
5.95
|
34.8
|
112.5
|
147.3
|
|
2021-22
|
6.01
|
2.25
|
8.26
|
41.27
|
121.21
|
162.48
|
|
2022-23
|
6.91
|
2.29
|
9.2
|
Not available
|
|
Source: Annual report 2022-23, Department of fisheries, Ministry of Fisheries, Animal Husbandry and Dairying, Government of India and Department of Fisheries, Government of Kerala
|
|
District wise fish production in Kerala 2022-23 (lakh tonnes)
|
|
District
|
Marine Fish Production
|
Inland Fish Production
|
Total Fish Production
|
|
Thiruvananthapuram
|
60715
|
2455
|
63170
|
|
Kollam
|
143373
|
12656
|
156029
|
|
Alappuzha
|
35674
|
43309
|
78983
|
|
Pathanamthitta
|
-
|
2736
|
2736
|
|
Kottayam
|
-
|
50808
|
256811
|
|
Ernakulam
|
206003
|
39068
|
39068
|
|
Idukki
|
-
|
1997
|
1997
|
|
Thrissur
|
36258
|
12422
|
48680
|
|
Palakkad
|
-
|
4595
|
4595
|
|
Malappuram
|
23828
|
3344
|
27172
|
|
Kozhikkode
|
116372
|
2528
|
118900
|
|
Wayanad
|
-
|
1329
|
1329
|
|
Kannur
|
57409
|
3401
|
60810
|
|
Kasargode
|
11313
|
48930
|
60243
|
|
State(Kerala)
|
690945
|
229578
|
920523
|
|
Source: Directorate of Fisheries
|
Inland capture and aquaculture:
The figure shows the steady growth of inland sector from 2013-14 to 2022-23. For a State like Kerala where the estimated inland water area comprises of 41 west flowing and 3 east flowing rivers with a total area of 85,000 ha, 9 fresh water lakes with an area of 1,620 ha and 51 backwaters with an area of 46,128.9 ha provides a wide scope for practising and developing aquaculture practices. Aquaculture is also a sustainable option to consumers, especially in comparison to other farmed proteins. Seafood is highly resource efficient and has the highest protein retention compared to chicken, pork and beef. It also has the lowest feed conversion ratio among the same forms of protein. Aquaculture has lower greenhouse gas emissions than other types of farming.
Fish Production in Kerala over the past ten years

Source: Department of Fisheries, Governmnet of Kerala, 2023
Export of Marine Products:
Export of marine products from India increased from 13,69,264 MT in 2021-22 to 17,35,286 MT in 2022-23. Total export value increased form Rs 57,586.50 crore in 2021-22 to Rs 63,969.15 crore in 2022-23. This shows a growth rate of 26.73 per cent in quantity exported and 11.08 per cent in value generated 2021-22. Kerala’s marine export grew from 1,80,315 MT in to 2,18,630 MT in 2022-23, and value increased from Rs 6,396.2 crore in 2021-22 to Rs 8,285.03 crore in 2022-23. This shows a growth rate of 21.25 per cent in volume of export and 29.53 per cent in value generated. The details are given below:
Export of marine products in India and Kerala 2016-17 to 2022-23, quantity in MT and value in Rs crore.
|
Year
|
India
|
Kerala
|
Kerala’s share (%)
|
|
Quantity
|
Value
|
Quantity
|
Value
|
Quantity
|
Value
|
|
2016-17
|
11,34,948
|
37,870.9
|
1,59,141
|
5,008.5
|
14.00
|
13.20
|
|
2017-18
|
13,77,244
|
45,106.9
|
1,78,646
|
5,919.0
|
13.00
|
13.10
|
|
2018-19
|
13,92,559
|
46,589.4
|
1,83,064
|
6,014.7
|
13.10
|
12.90
|
|
2019-20
|
12,89,651
|
46,662.9
|
1,48,226
|
5,020.3
|
11.50
|
10.80
|
|
2020-21
|
11,49,510
|
43,721.0
|
1,44,700
|
5,039.9
|
12.60
|
11.50
|
|
2021-22
|
13,69,264
|
57,586.5
|
1,80,315
|
6,396.2
|
13.20
|
11.10
|
|
2022-23
|
17,35,286
|
63,969.15
|
2,18,630
|
8,285.03
|
12.60
|
13.00
|
|
Source: Marine Products Export Development Agency (MPEDA)
|
20th Livestock Census in Kerala
Source:
(1)Directorate of Fisheries
(2) Livestock census report/animal husbandry department
(3) Directorate of Economics and Statistics
(4) Economic Review 2010-2023